Free Access
Fig. 3.
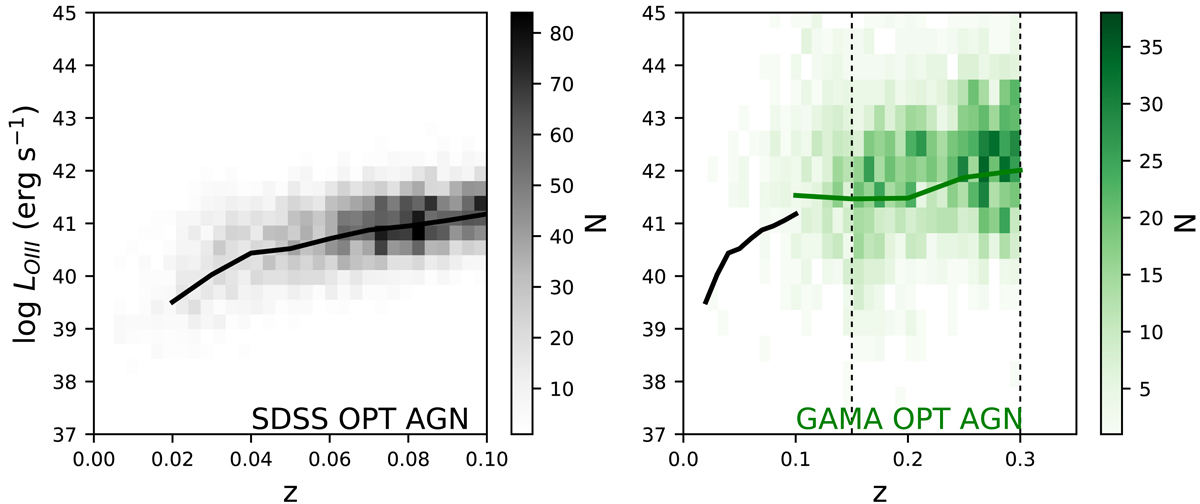
[O III] luminosity LO III vs. redshift z distributions for the SDSS and GAMA OPT AGNs. The solid lines indicate the running median for each group. The dashed lines mark the edges of the redshift bins for the GAMA OPT AGNs. In the same redshift range, the GAMA OPT AGNs are less powerful than the SDSS OPT AGNs.
Current usage metrics show cumulative count of Article Views (full-text article views including HTML views, PDF and ePub downloads, according to the available data) and Abstracts Views on Vision4Press platform.
Data correspond to usage on the plateform after 2015. The current usage metrics is available 48-96 hours after online publication and is updated daily on week days.
Initial download of the metrics may take a while.