Fig. 10.
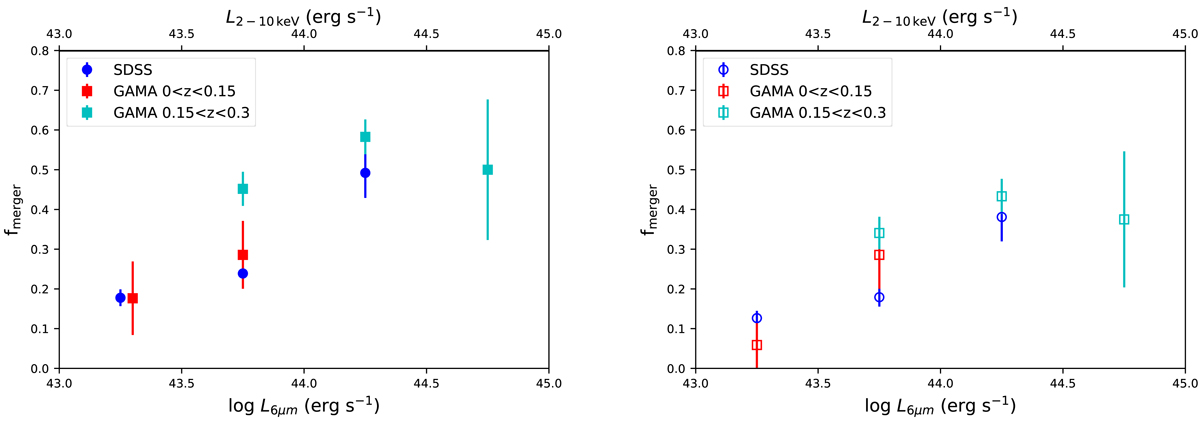
Left: distributions of merger fractions in MIR AGNs as rest-frame 6 μm luminosity increases for the SDSS sample and the GAMA sample. For the GAMA sample we also separate them into three redshift bins but the highest redshift bin is not shown due to the small sample size. Right: same as left panel, but with stricter merger identification. Errors are calculated through binomial statistics.
Current usage metrics show cumulative count of Article Views (full-text article views including HTML views, PDF and ePub downloads, according to the available data) and Abstracts Views on Vision4Press platform.
Data correspond to usage on the plateform after 2015. The current usage metrics is available 48-96 hours after online publication and is updated daily on week days.
Initial download of the metrics may take a while.