Fig. 1.
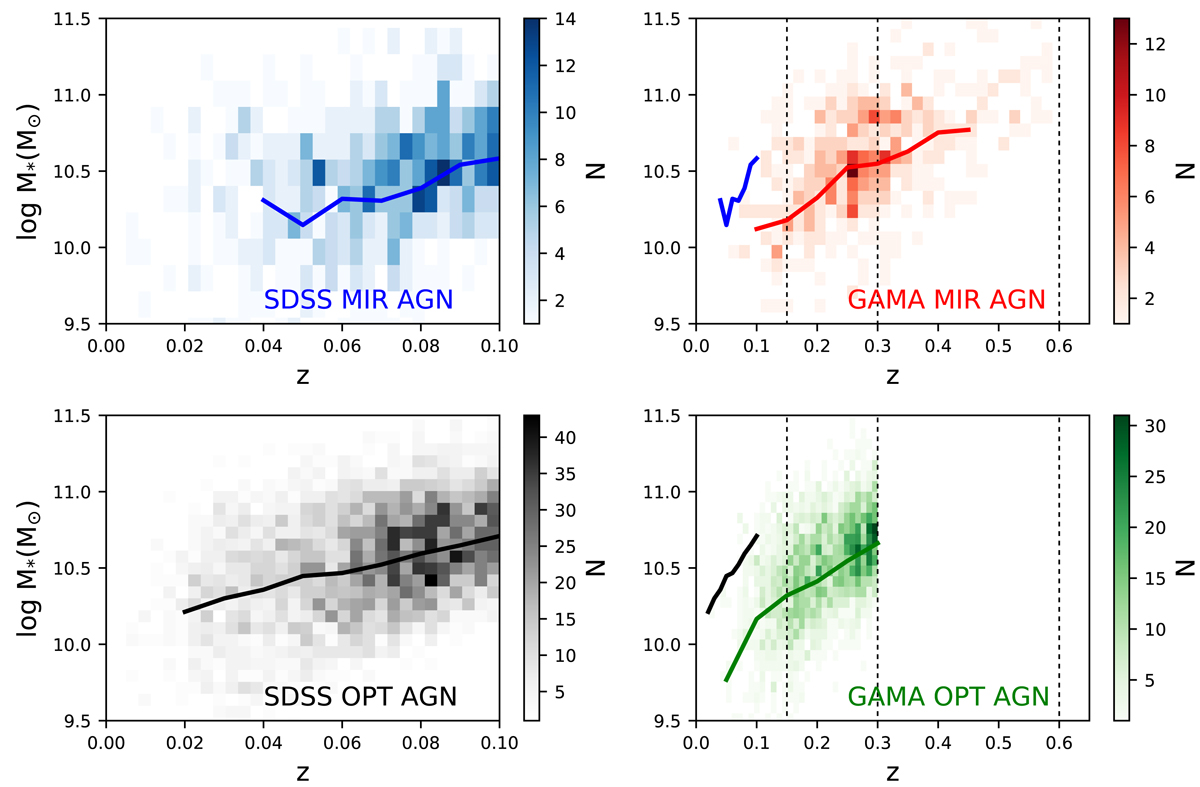
Stellar mass M* vs. redshift z distributions for the SDSS and GAMA AGNs. Red and green distributions represent MIR and OPT AGNs for the GAMA sample respectively. Blue and gray distributions represent MIR and OPT AGNs for the SDSS sample respectively. The solid lines indicate the running median for each group. The dashed lines mark the edges of the redshift bins for the GAMA AGNs (see Sect. 3.1). In the SDSS sample, the OPT AGNs are hosted in more massive galaxies than the MIR AGNs. In the same redshift range, the GAMA AGNs are hosted in less massive galaxies than the SDSS AGNs.
Current usage metrics show cumulative count of Article Views (full-text article views including HTML views, PDF and ePub downloads, according to the available data) and Abstracts Views on Vision4Press platform.
Data correspond to usage on the plateform after 2015. The current usage metrics is available 48-96 hours after online publication and is updated daily on week days.
Initial download of the metrics may take a while.