Fig. 9
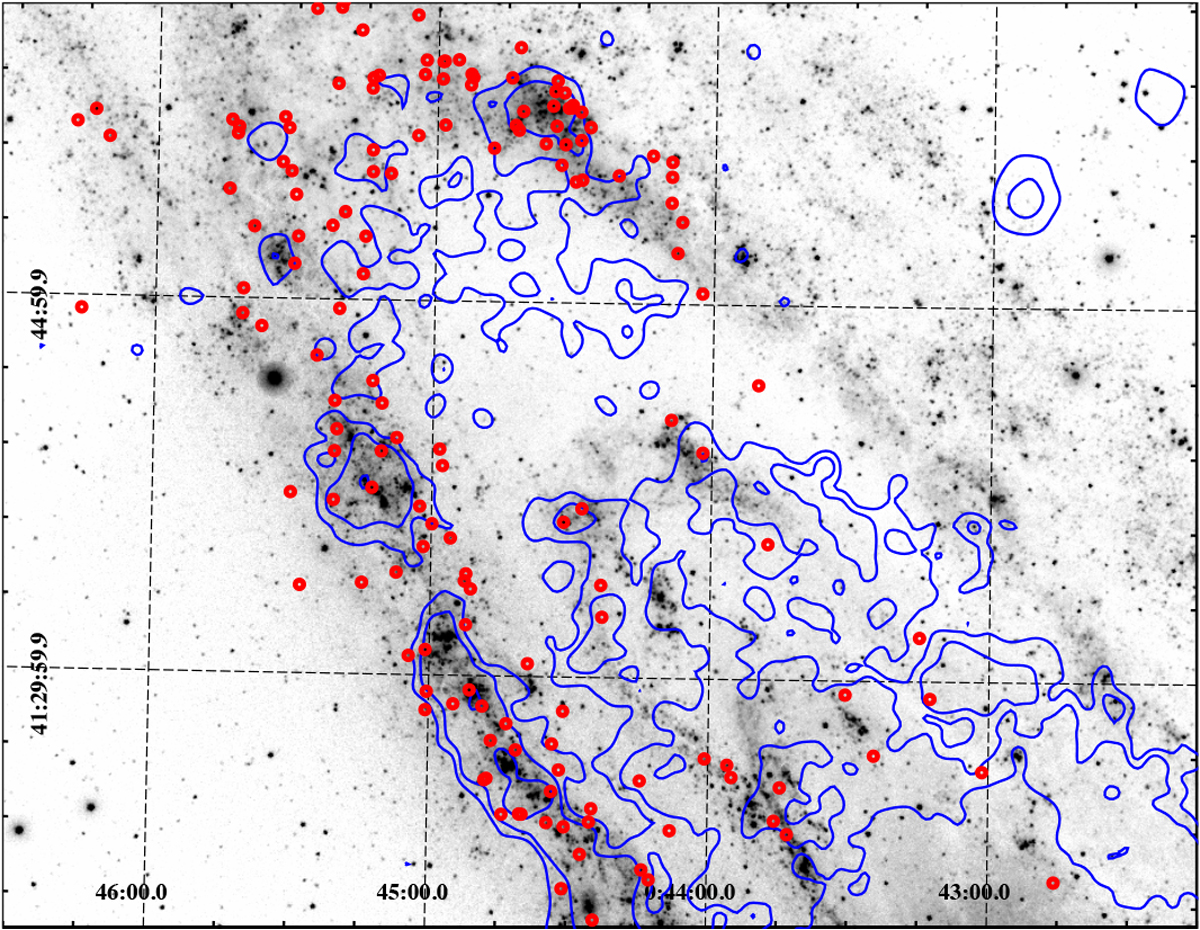
NUV image from Fig. 8 bottom-right, with stellar clusters from Johnson et al. (2016) shown by the red dots. The clusters have mass greater than 103 M⊙ and ages less than 100 Myr. The 0.4–1.25 keV X-ray contours from Fig. 2 are also shown in blue to highlight the correlation between the stellar clusters and X-ray emission. No clusters are plotted in the 10 kpc ring north of the core as this region was not studied in Johnson et al. (2016).
Current usage metrics show cumulative count of Article Views (full-text article views including HTML views, PDF and ePub downloads, according to the available data) and Abstracts Views on Vision4Press platform.
Data correspond to usage on the plateform after 2015. The current usage metrics is available 48-96 hours after online publication and is updated daily on week days.
Initial download of the metrics may take a while.