Fig. 4
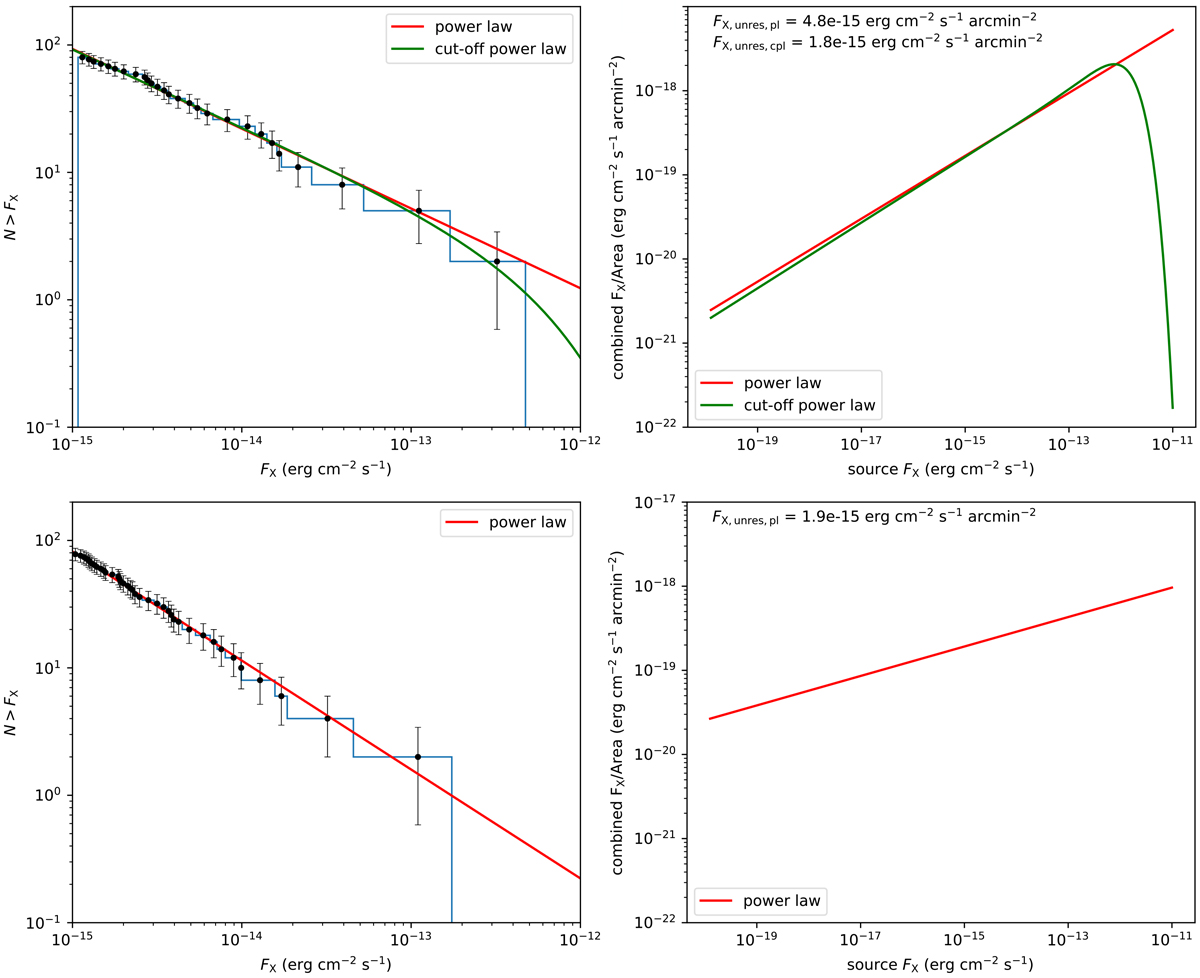
X-ray flux distributions of M31 sources detected in the southern (top row) and northern (bottom row) deep fields in the northern disc. Left panels: X-ray flux functions, along with power law and cut-off power law fits. Right panels: combined flux distribution expected from sources in flux bins, normalised for the deep field areas. The unresolved flux per unit area is determined by integrating over this distribution and subtracting the flux of detected sources.
Current usage metrics show cumulative count of Article Views (full-text article views including HTML views, PDF and ePub downloads, according to the available data) and Abstracts Views on Vision4Press platform.
Data correspond to usage on the plateform after 2015. The current usage metrics is available 48-96 hours after online publication and is updated daily on week days.
Initial download of the metrics may take a while.