Fig. 2
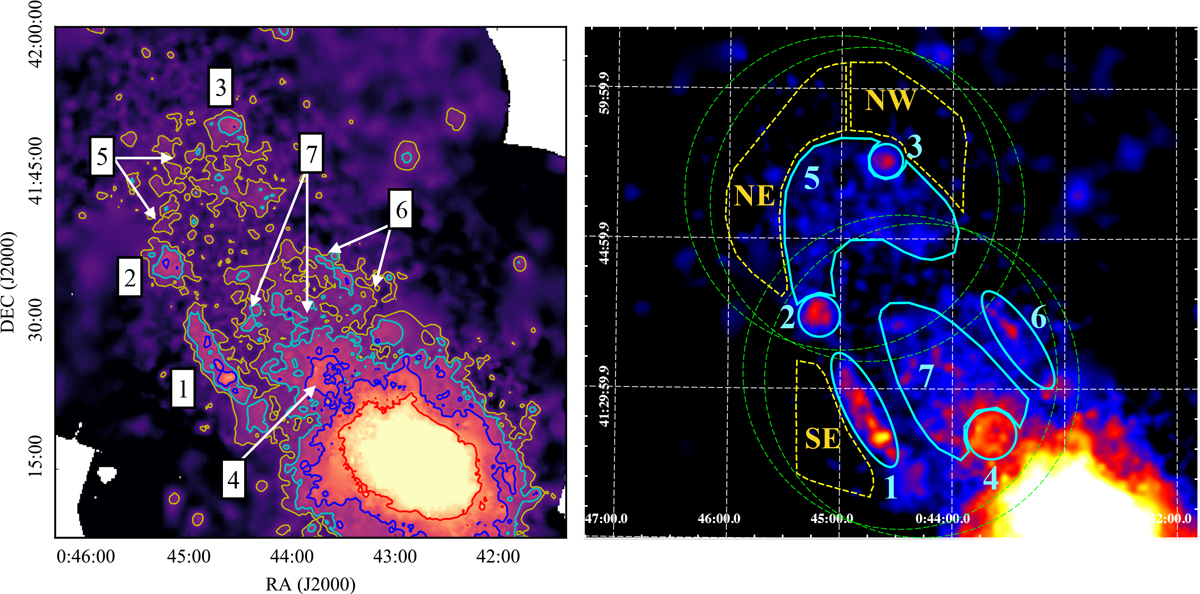
Left: XMM-Newton 0.4–1.25 keV image of the northern disc of M31 with contours. The image has been adaptively smoothed and masked point sources filled as described in the text. Yellow, cyan, blue, and red contours correspond to 5, 10, 20, and 50σ above the average background level determined from regions exterior to the northern disc. Regions of interest discussed in the text are marked. Right: XMM-Newton 0.4–1.25 keV image of the northern disc with the spectral extraction regions defined from the contours in left shown in cyan. Background regions are shown in yellow. The deep EPIC northern disc fields are shown by the green circles.
Current usage metrics show cumulative count of Article Views (full-text article views including HTML views, PDF and ePub downloads, according to the available data) and Abstracts Views on Vision4Press platform.
Data correspond to usage on the plateform after 2015. The current usage metrics is available 48-96 hours after online publication and is updated daily on week days.
Initial download of the metrics may take a while.