Fig. B.1
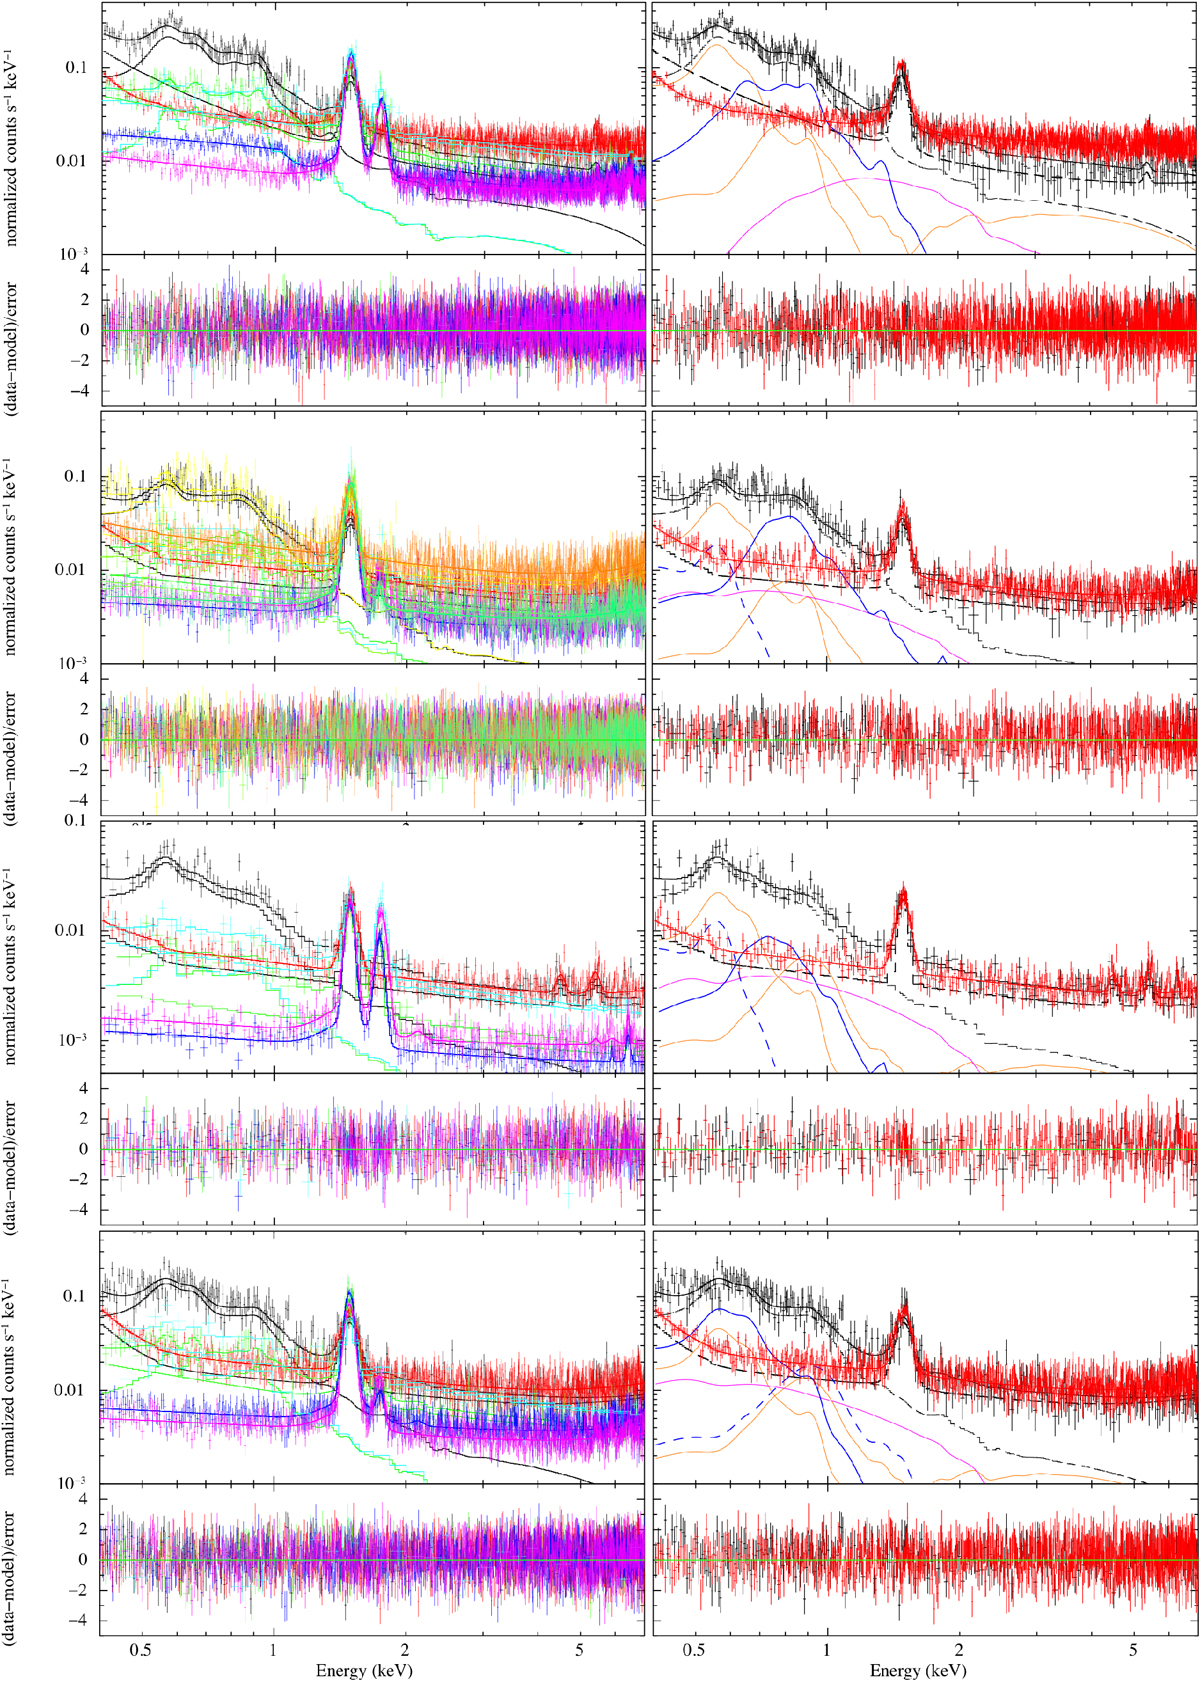
XMM-Newton spectral fits of our extended emission Regions 1 through 4, arranged from top to bottom. Left panels: fits to all spectra. Right panels: EPIC spectra with the most counts along with additive components of the best fit model for clarity. The red data points and line are the FWC data and best fit. The black data points and associated lines are theobservational spectra, best fit model (solid), combined astrophysical components (dash-dot), and combined particle-induced components (FWC plus residual SP, dashed). The orange lines represent the AXB components, the magenta line shows the unresolved SNR, XRB, and SSS component (see Sect. 2.3.1 for descriptions), blue solid lines represent the M31 ISM component with the dashed blue lines indicating the contamination of smaller regions by larger extended emission regions (e.g. Region 5 component in Region 2). Best fit parameters are given in Table 2.
Current usage metrics show cumulative count of Article Views (full-text article views including HTML views, PDF and ePub downloads, according to the available data) and Abstracts Views on Vision4Press platform.
Data correspond to usage on the plateform after 2015. The current usage metrics is available 48-96 hours after online publication and is updated daily on week days.
Initial download of the metrics may take a while.