Fig. 10
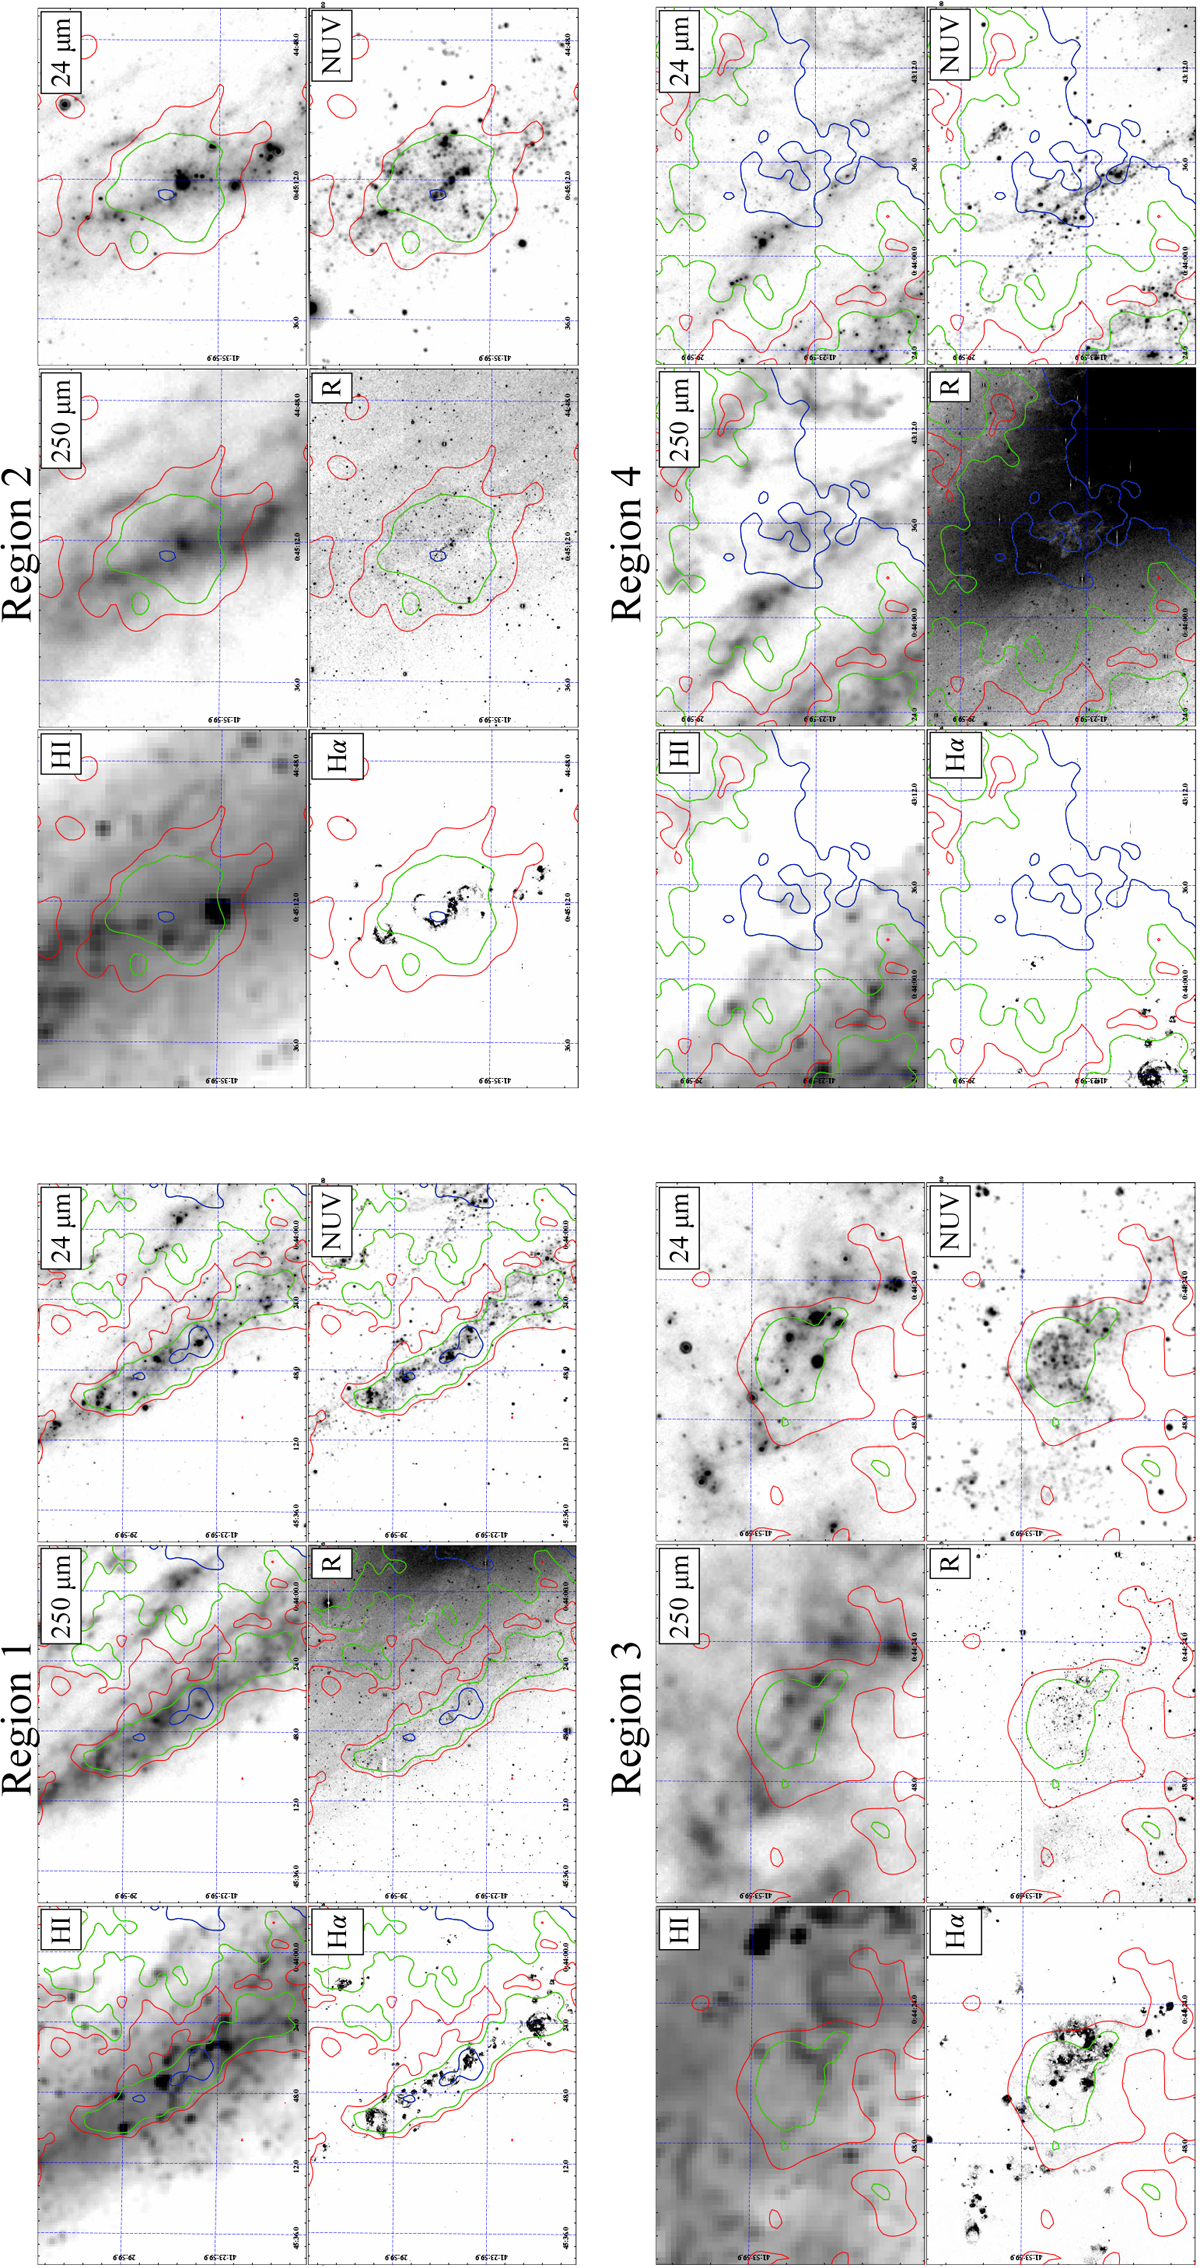
Close-up, multi-wavelength views of extended emission regions asso- ciated with populations of massive stars with the wavebands indicated in the panes. The red, green, and blue contours correspond to 5, 10, and 20σ above the average background level determined from regions exterior to the northern disc. The individual regions are indicated onthe plot
Current usage metrics show cumulative count of Article Views (full-text article views including HTML views, PDF and ePub downloads, according to the available data) and Abstracts Views on Vision4Press platform.
Data correspond to usage on the plateform after 2015. The current usage metrics is available 48-96 hours after online publication and is updated daily on week days.
Initial download of the metrics may take a while.