Fig. 1
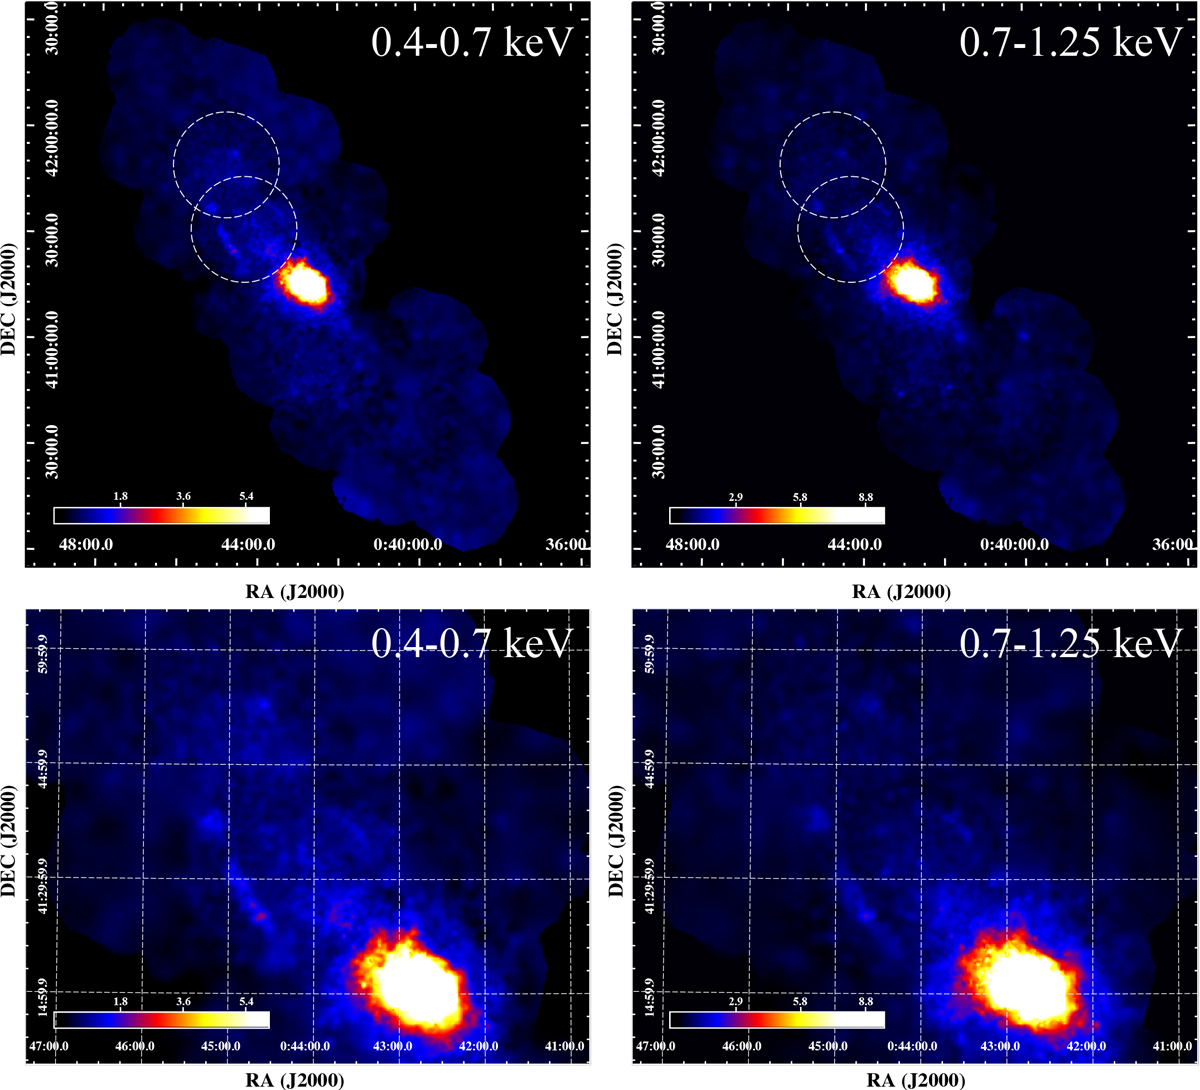
XMM-Newton mosaic images of M31 with 0.4–0.7 keV shown in top-left and 0.7–1.25 keV in top-right. The white dashed circles mark the fields of our northern disc LP survey, which are revealed in more detail in the zoomed images in bottom-left and bottom-right. The XMM-Newton coverage in relation to the stellar population is shown in Fig. 1 of Stiele et al. (2011). The colours are in linear scale as shown by the colour bars in each image. The units of the images are cts s−1 deg−2.
Current usage metrics show cumulative count of Article Views (full-text article views including HTML views, PDF and ePub downloads, according to the available data) and Abstracts Views on Vision4Press platform.
Data correspond to usage on the plateform after 2015. The current usage metrics is available 48-96 hours after online publication and is updated daily on week days.
Initial download of the metrics may take a while.