Fig. 8.
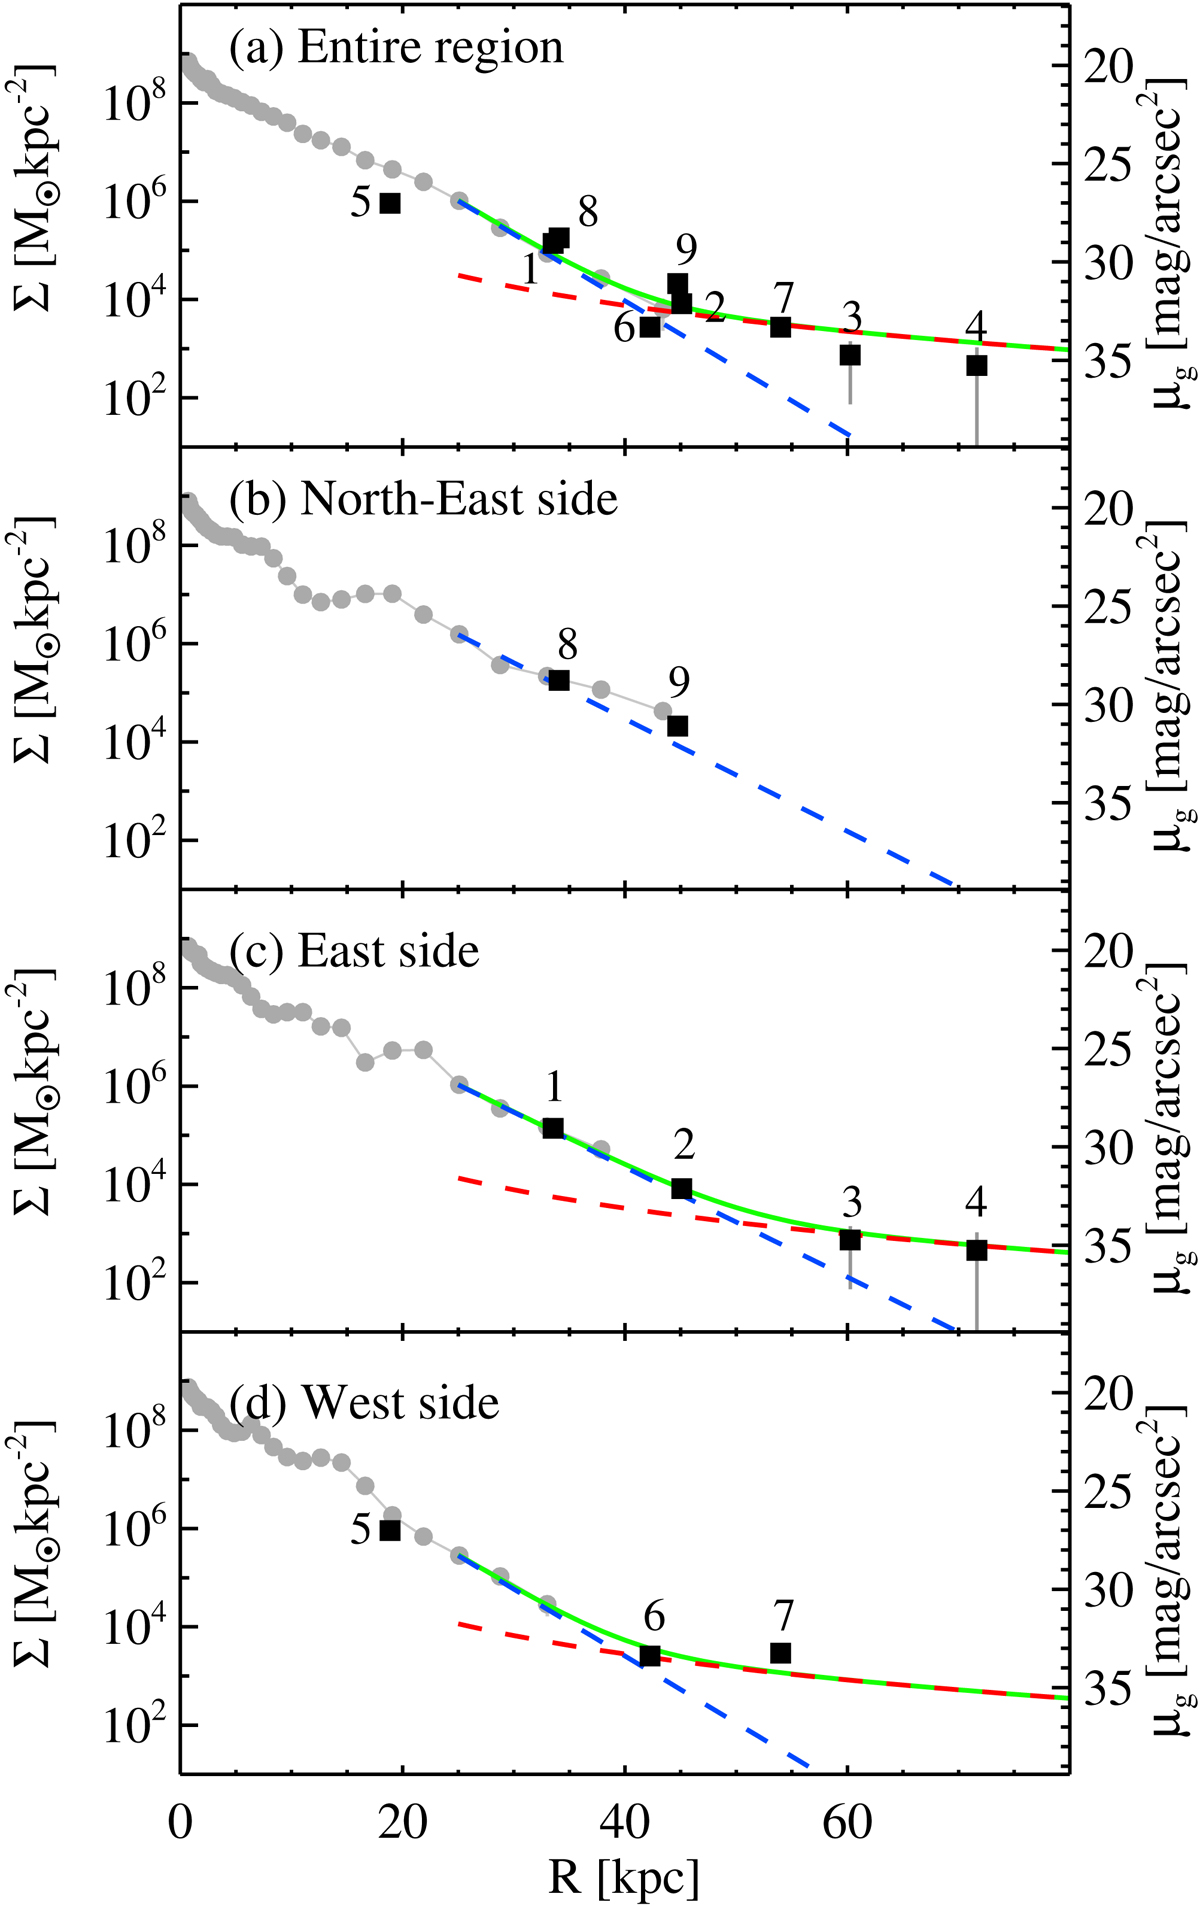
Same as Fig. 7, but with two component fits to the density profiles: outer disk (blue dashed lines, exponential law), halo (red dashed lines, power law). The sum of the two component fits beyond 25 kpc are indicated by green lines. The halo component is not detected in the northeast side (b) so we plotted a fit for the outer disk only.
Current usage metrics show cumulative count of Article Views (full-text article views including HTML views, PDF and ePub downloads, according to the available data) and Abstracts Views on Vision4Press platform.
Data correspond to usage on the plateform after 2015. The current usage metrics is available 48-96 hours after online publication and is updated daily on week days.
Initial download of the metrics may take a while.