Fig. 7.
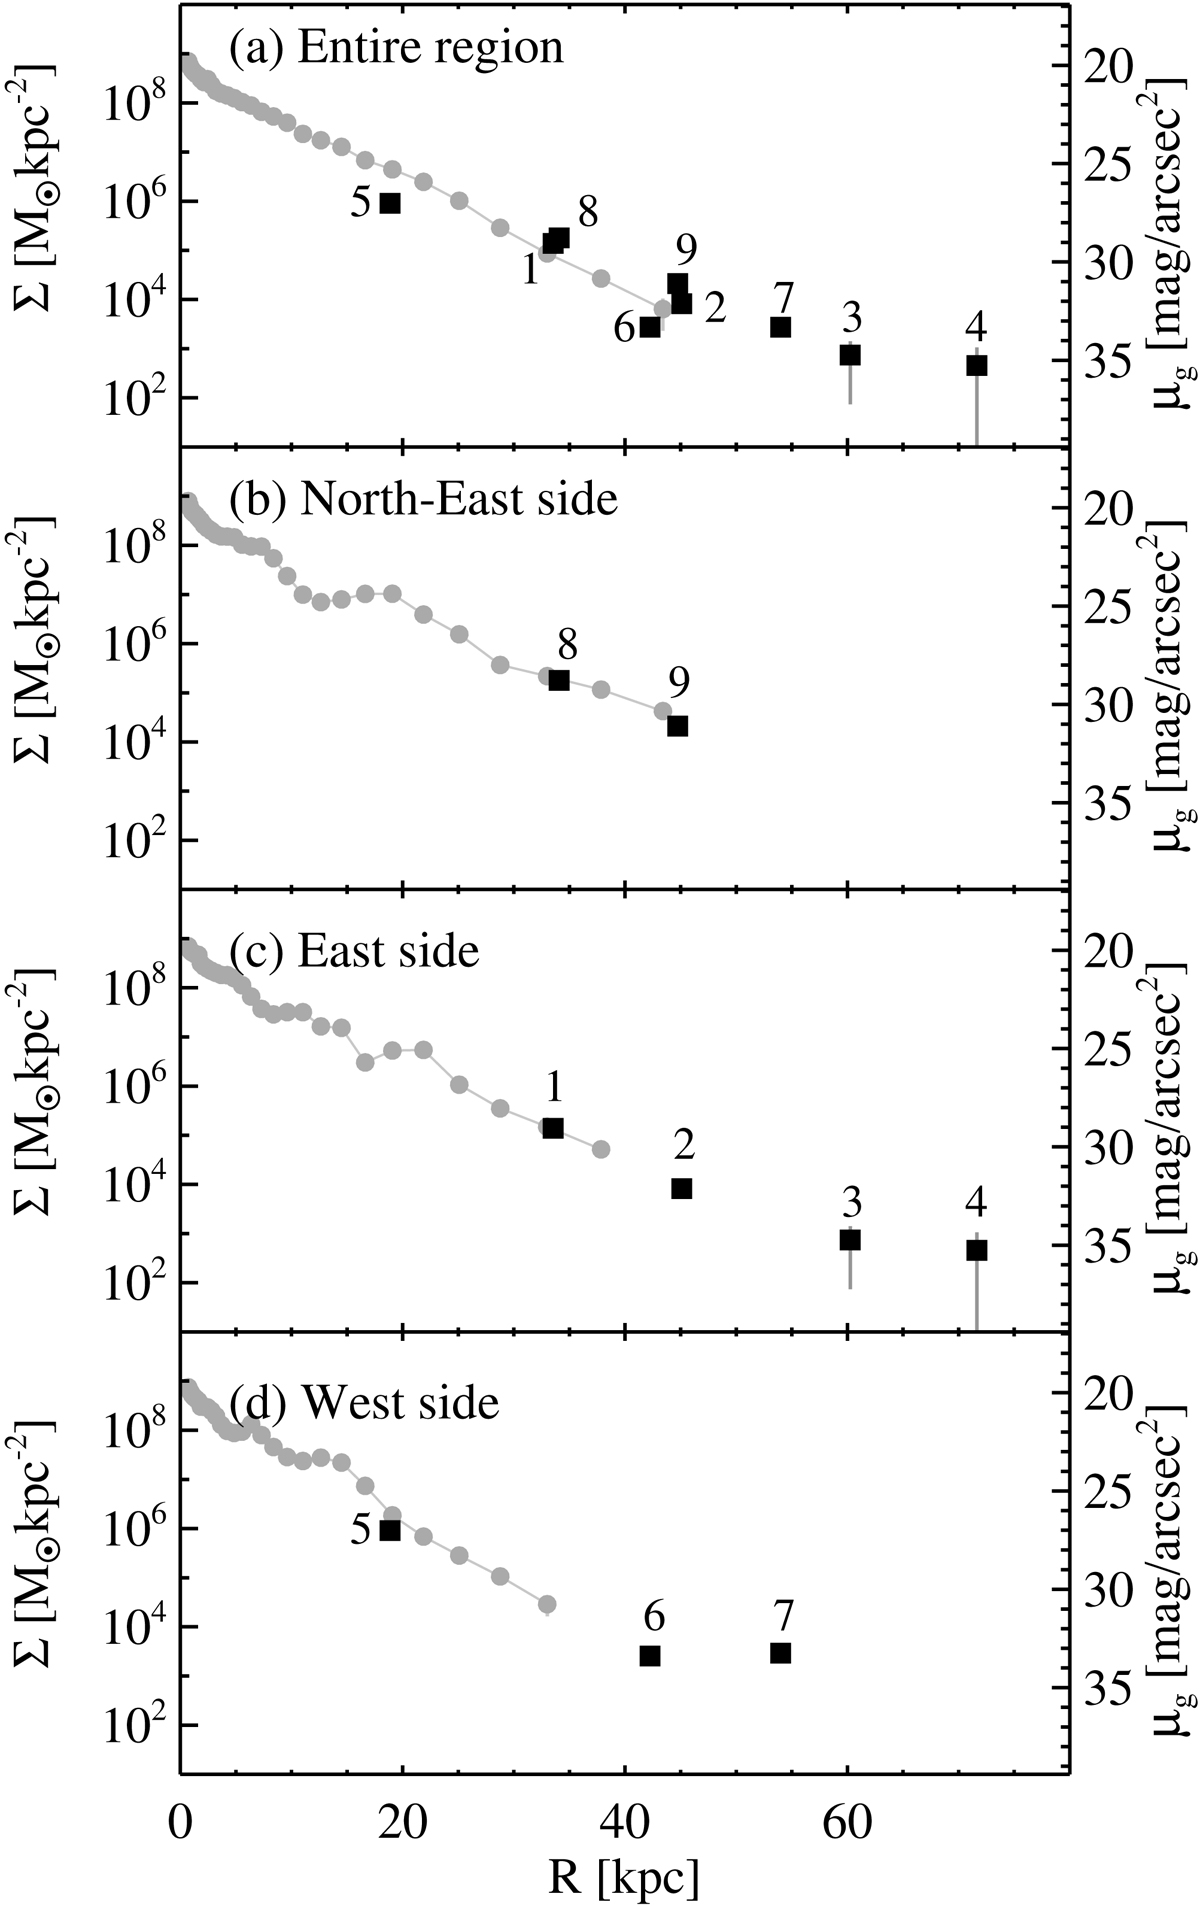
Radial mass surface density profiles taken from the entire region (a), the northeast side (b), the east side (c), and the west side (d) of M 101. Circles and squares represent the profiles from the integrated light and the resolved blue RGB stars, respectively. Error bars are smaller than the symbol sizes in most cases so they are not readily seen.
Current usage metrics show cumulative count of Article Views (full-text article views including HTML views, PDF and ePub downloads, according to the available data) and Abstracts Views on Vision4Press platform.
Data correspond to usage on the plateform after 2015. The current usage metrics is available 48-96 hours after online publication and is updated daily on week days.
Initial download of the metrics may take a while.