Fig. 6.
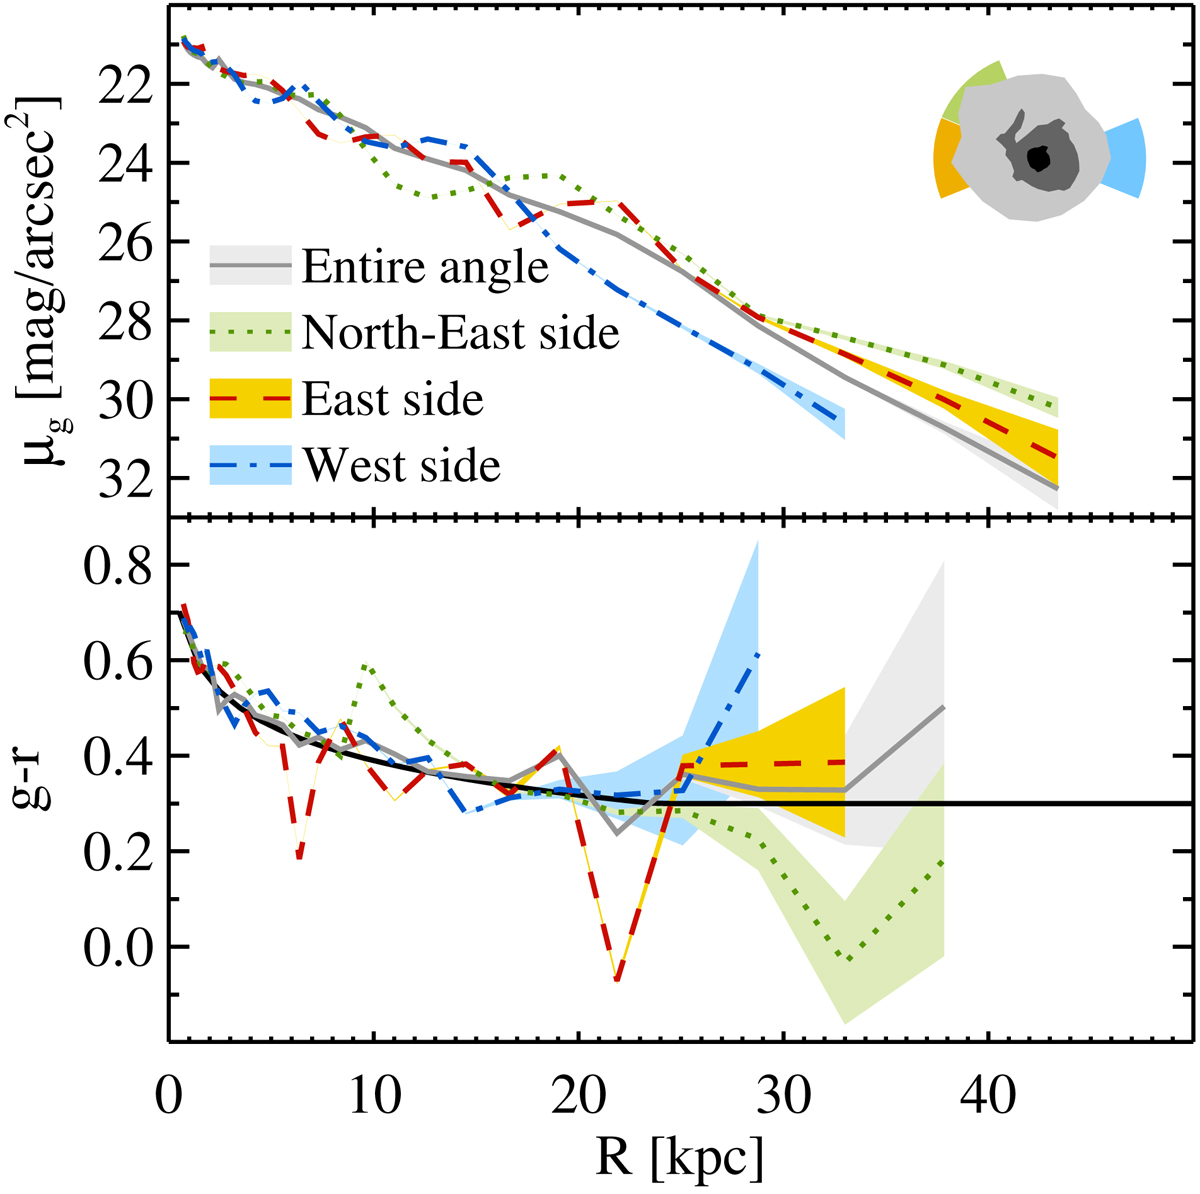
Top: radial g-band surface brightness profiles of M 101 taken along different azimuthal selections: azimuthally averaged (solid gray line), along the northeast side (green dotted line), along the east side (orange dashed line), and along the west side (blue dot-dashed line). Shaded regions represent uncertainties. A schematic picture of M 101 has the same color coding as the profiles. Three profiles along the northeast, east, and west sides show large differences at the outskirts. Bottom: radial color profiles. The black solid line is an approximation of g − r color from the Eq. (10) of the text.
Current usage metrics show cumulative count of Article Views (full-text article views including HTML views, PDF and ePub downloads, according to the available data) and Abstracts Views on Vision4Press platform.
Data correspond to usage on the plateform after 2015. The current usage metrics is available 48-96 hours after online publication and is updated daily on week days.
Initial download of the metrics may take a while.