Fig. A.3.
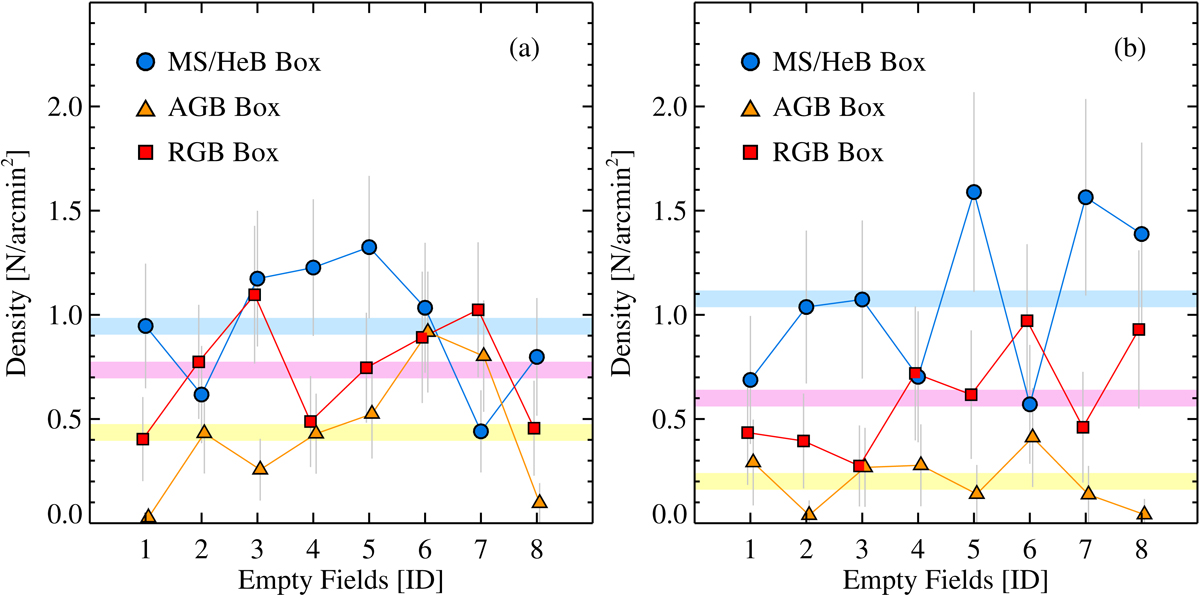
a: distributions of the unresolved object densities in the MS + HeB (circles), AGB (triangles), RGB (squares) bins in the eight empty fields taken with ACS. Error bars denote 1σ Poisson uncertainties of the object count. The mean level of each object population is indicated by a shaded region. Right: same as (a) but for WFC3 fields.
Current usage metrics show cumulative count of Article Views (full-text article views including HTML views, PDF and ePub downloads, according to the available data) and Abstracts Views on Vision4Press platform.
Data correspond to usage on the plateform after 2015. The current usage metrics is available 48-96 hours after online publication and is updated daily on week days.
Initial download of the metrics may take a while.