Fig. 14.
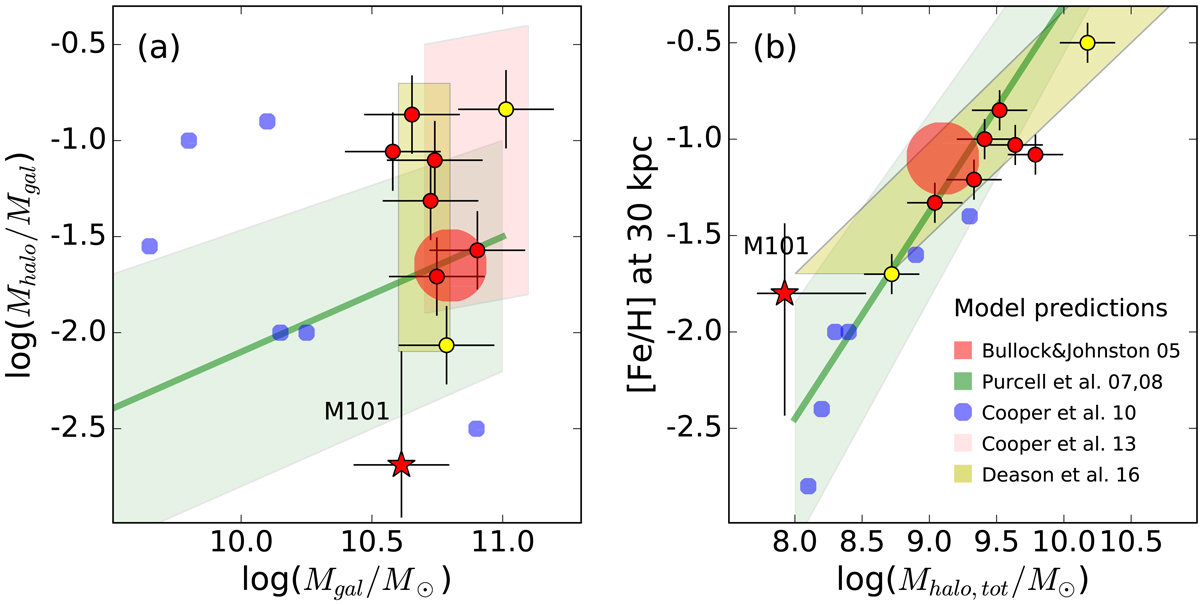
a: total stellar halo mass fraction as a function of total galaxy stellar mass. b: stellar halo metallicity as a function of the total stellar mass of the galaxy. Observed galaxies are marked by symbols with error bars: six GHOSTS galaxies (red circles), the MW and M 31 (yellow circles), and M 101 in this study (starlet symbol). Shaded regions indicate model predictions in the literature: Bullock & Johnston (2005, red area), Purcell et al. (2007, 2008, light green area with a green line), Cooper et al. (2010, blue circles), Cooper et al. (2013, pink area), Deason et al. (2016, light yellow area).
Current usage metrics show cumulative count of Article Views (full-text article views including HTML views, PDF and ePub downloads, according to the available data) and Abstracts Views on Vision4Press platform.
Data correspond to usage on the plateform after 2015. The current usage metrics is available 48-96 hours after online publication and is updated daily on week days.
Initial download of the metrics may take a while.