Fig. 12.
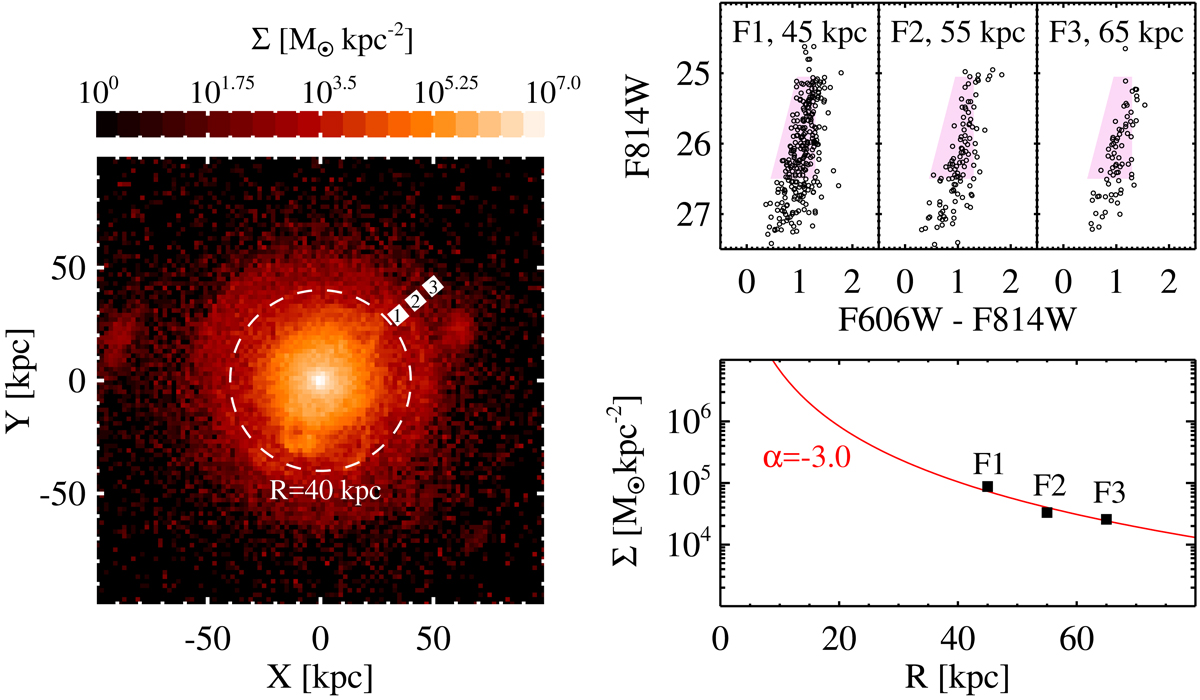
Left: face-on view of the Halo02 model in Bullock & Johnston (2005). A dashed line represents R = 40 kpc radius centered on the halo model. Three ACS-like fields at R = 45, 55, and 65 kpc are marked by white squares. Top right: CMDs of inferred stars from the three ACS-like fields in the halo model. Stars are shifted to the M 101 distance. Shaded regions are the RGB selection bins used in this study. Bottom right: radial mass density profiles measured from the bright RGB stars in the selected fields. A solid line indicates the power-law fit with a slope of αh = −3.0.
Current usage metrics show cumulative count of Article Views (full-text article views including HTML views, PDF and ePub downloads, according to the available data) and Abstracts Views on Vision4Press platform.
Data correspond to usage on the plateform after 2015. The current usage metrics is available 48-96 hours after online publication and is updated daily on week days.
Initial download of the metrics may take a while.