Fig. 1.
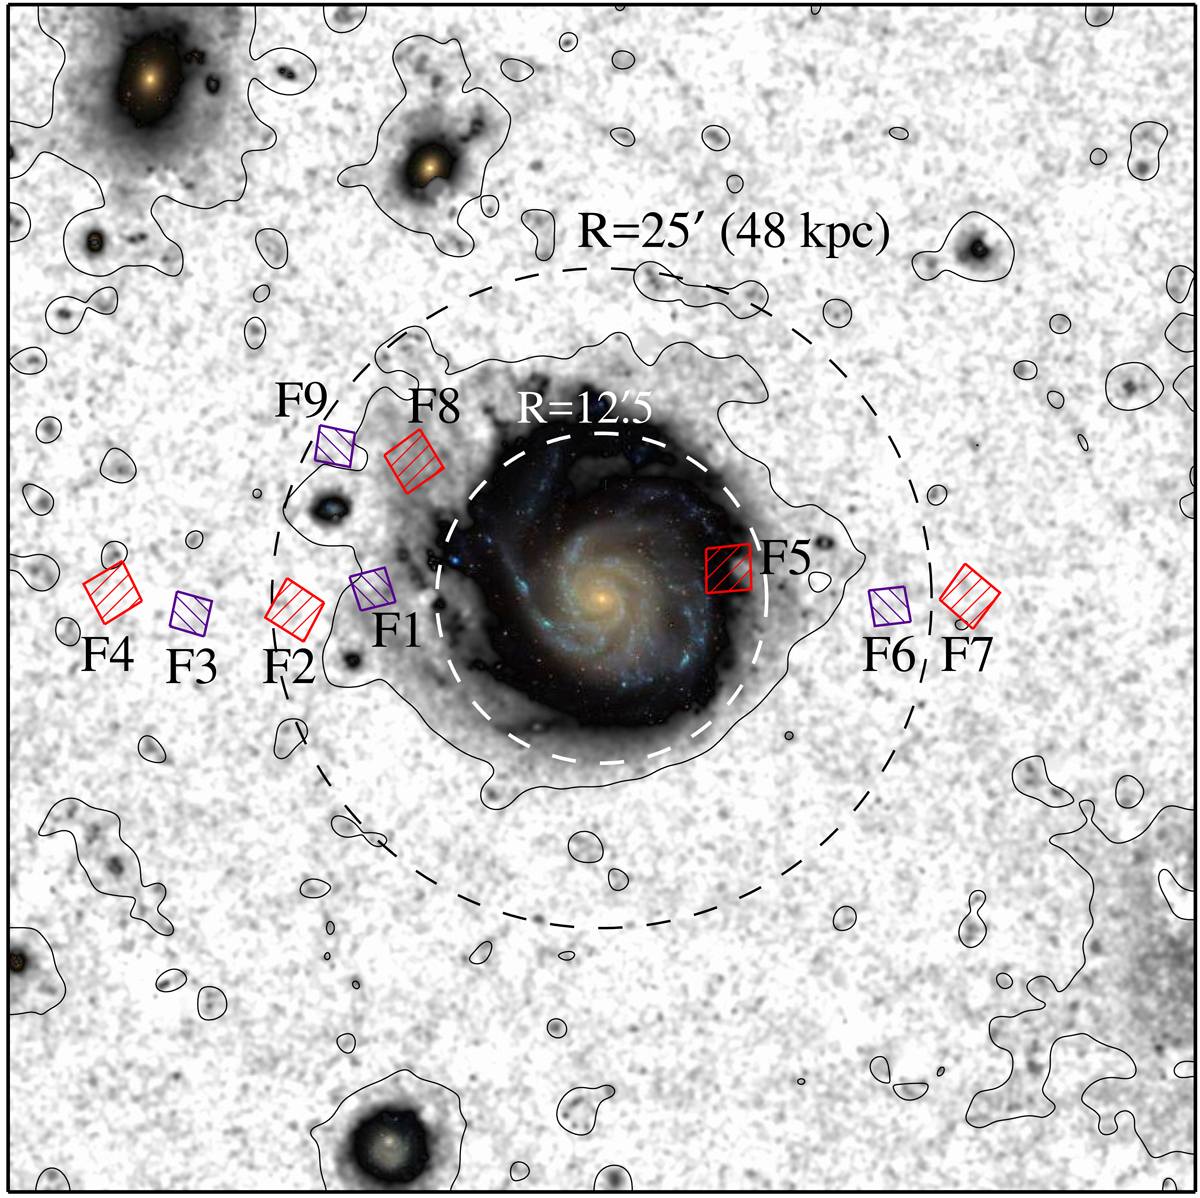
Location of HST ACS (red squares) and WFC3 (purple squares) fields overlaid on a deep 75′ × 75′ g-band image provided by the DNGS (Abraham & van Dokkum 2014). North is up and east is to the left. High surface brightness regions of the g-band image are replaced by the color image from the SDSS. The white and black dashed lines represent circles with ![]() (24 kpc) and 25′ (48 kpc) radii centered on M 101, respectively. A black contour line indicates a smoothed iso-surface brightness level of μg = 30 mag arcsec−2 measured in this study.
(24 kpc) and 25′ (48 kpc) radii centered on M 101, respectively. A black contour line indicates a smoothed iso-surface brightness level of μg = 30 mag arcsec−2 measured in this study.
Current usage metrics show cumulative count of Article Views (full-text article views including HTML views, PDF and ePub downloads, according to the available data) and Abstracts Views on Vision4Press platform.
Data correspond to usage on the plateform after 2015. The current usage metrics is available 48-96 hours after online publication and is updated daily on week days.
Initial download of the metrics may take a while.