Open Access
Fig. 9.
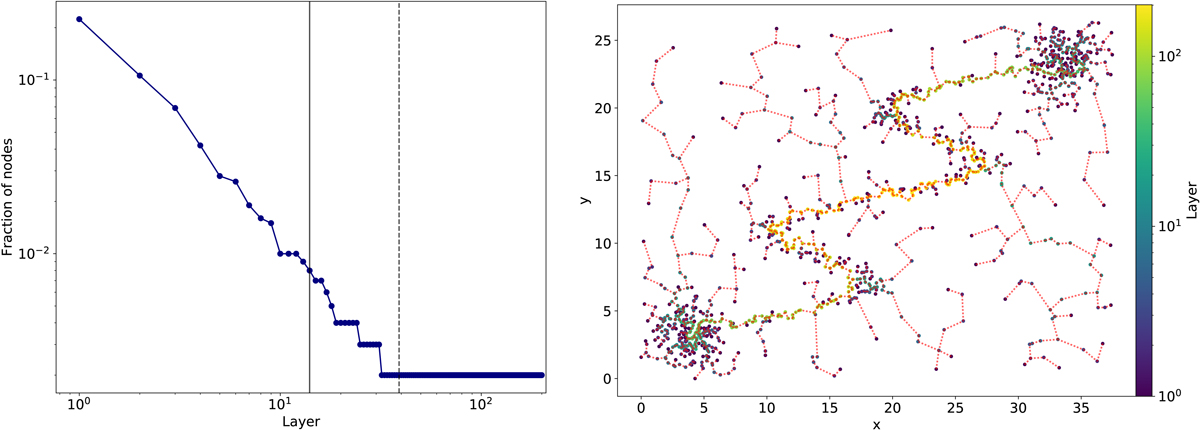
Left: onion spectrum of the tree structure. Vertical lines correspond to l = 14 (solid) and l = 39 (dashed) discussed in Sect. 4.1. Right: layer value of each datapoint. Red dashed line is the MST and dots are data points from a noisy version of the toy dataset (obtained by adding 25% uniform noise in the bounding box).
Current usage metrics show cumulative count of Article Views (full-text article views including HTML views, PDF and ePub downloads, according to the available data) and Abstracts Views on Vision4Press platform.
Data correspond to usage on the plateform after 2015. The current usage metrics is available 48-96 hours after online publication and is updated daily on week days.
Initial download of the metrics may take a while.