Open Access
Fig. 15.
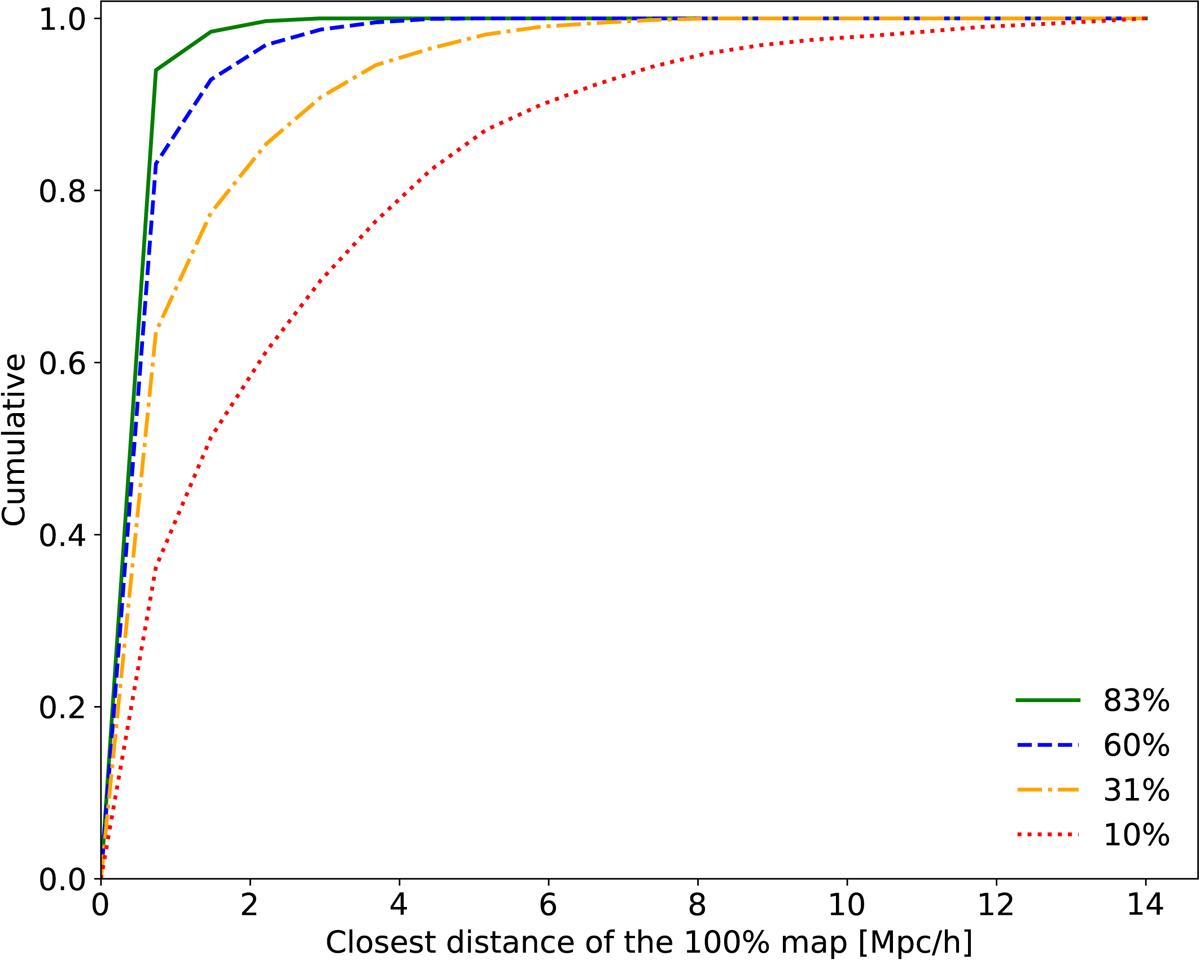
Cumulative distribution of distances ![]() (see Sect. 6.1.2) between positions of the binary maps Γ0.25(I100) obtained with increasing mass threshold Mcut to the one with J% of the data points. Mcut = {0.85, 1.35, 3.22, 11}×1010 M⊙ h−1 leading respectively to 83%, 60%, 31% and 10% of the total number of subhalos in the slice.
(see Sect. 6.1.2) between positions of the binary maps Γ0.25(I100) obtained with increasing mass threshold Mcut to the one with J% of the data points. Mcut = {0.85, 1.35, 3.22, 11}×1010 M⊙ h−1 leading respectively to 83%, 60%, 31% and 10% of the total number of subhalos in the slice.
Current usage metrics show cumulative count of Article Views (full-text article views including HTML views, PDF and ePub downloads, according to the available data) and Abstracts Views on Vision4Press platform.
Data correspond to usage on the plateform after 2015. The current usage metrics is available 48-96 hours after online publication and is updated daily on week days.
Initial download of the metrics may take a while.