Fig. 13.
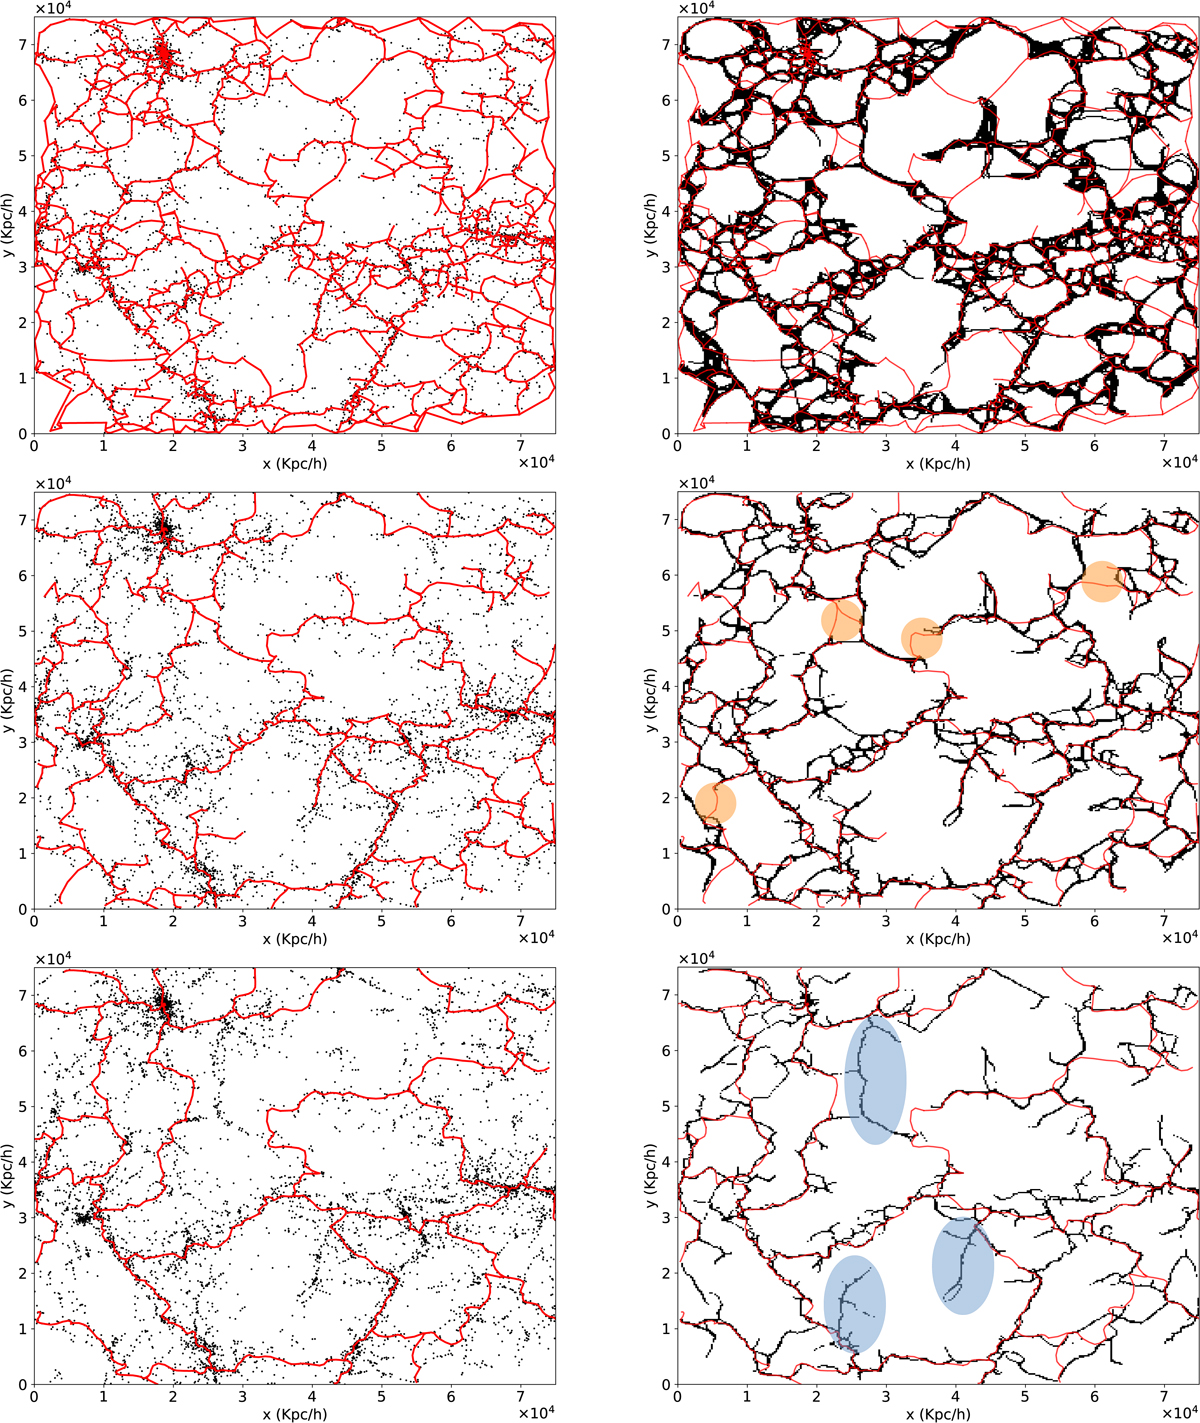
Left column: subhalos (black dots) and DisPerSE skeletons (red lines) with several significance levels (from top to bottom: σp = 0, 2, 5). Right column: superimposition of some thresholded probability maps obtained by T-ReX and DisPerSE skeletons (red lines) with several significance levels (from top to bottom: σp = 0 and Γ0.0(I), σp = 2 and Γ0.1(I), σp = 5 and Γ0.25(I)). Resolution of the maps provided by T-ReX is 250 Kpc h−1. Shaded blue and orange areas highlight some differences between results discussed in Sect. 6.1.1.
Current usage metrics show cumulative count of Article Views (full-text article views including HTML views, PDF and ePub downloads, according to the available data) and Abstracts Views on Vision4Press platform.
Data correspond to usage on the plateform after 2015. The current usage metrics is available 48-96 hours after online publication and is updated daily on week days.
Initial download of the metrics may take a while.