Free Access
Fig. 4.
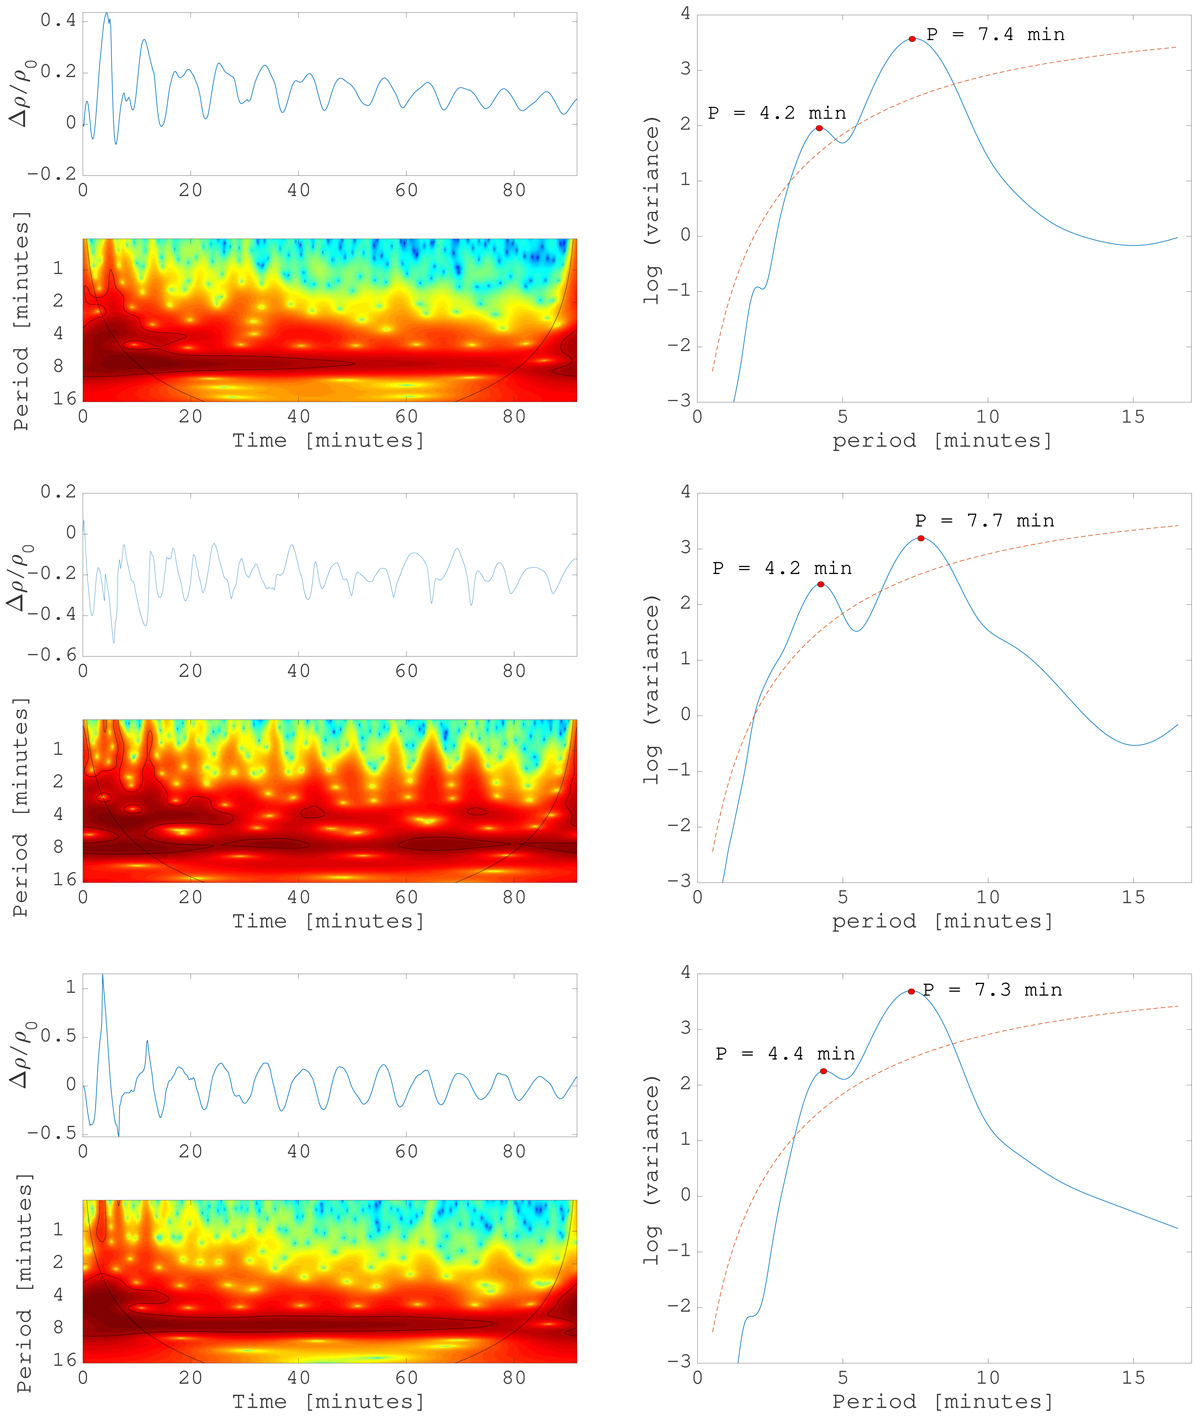
Wave signal and corresponding wavelet power spectrum (left) and the global wavelet spectrum showing the period (right). The red dashed line designates the cone of influence of the wavelet spectrum. The results are shown for three different detection points placed in the axis of the symmetry: see the black circles in Fig. 1.
Current usage metrics show cumulative count of Article Views (full-text article views including HTML views, PDF and ePub downloads, according to the available data) and Abstracts Views on Vision4Press platform.
Data correspond to usage on the plateform after 2015. The current usage metrics is available 48-96 hours after online publication and is updated daily on week days.
Initial download of the metrics may take a while.