Fig. 9.
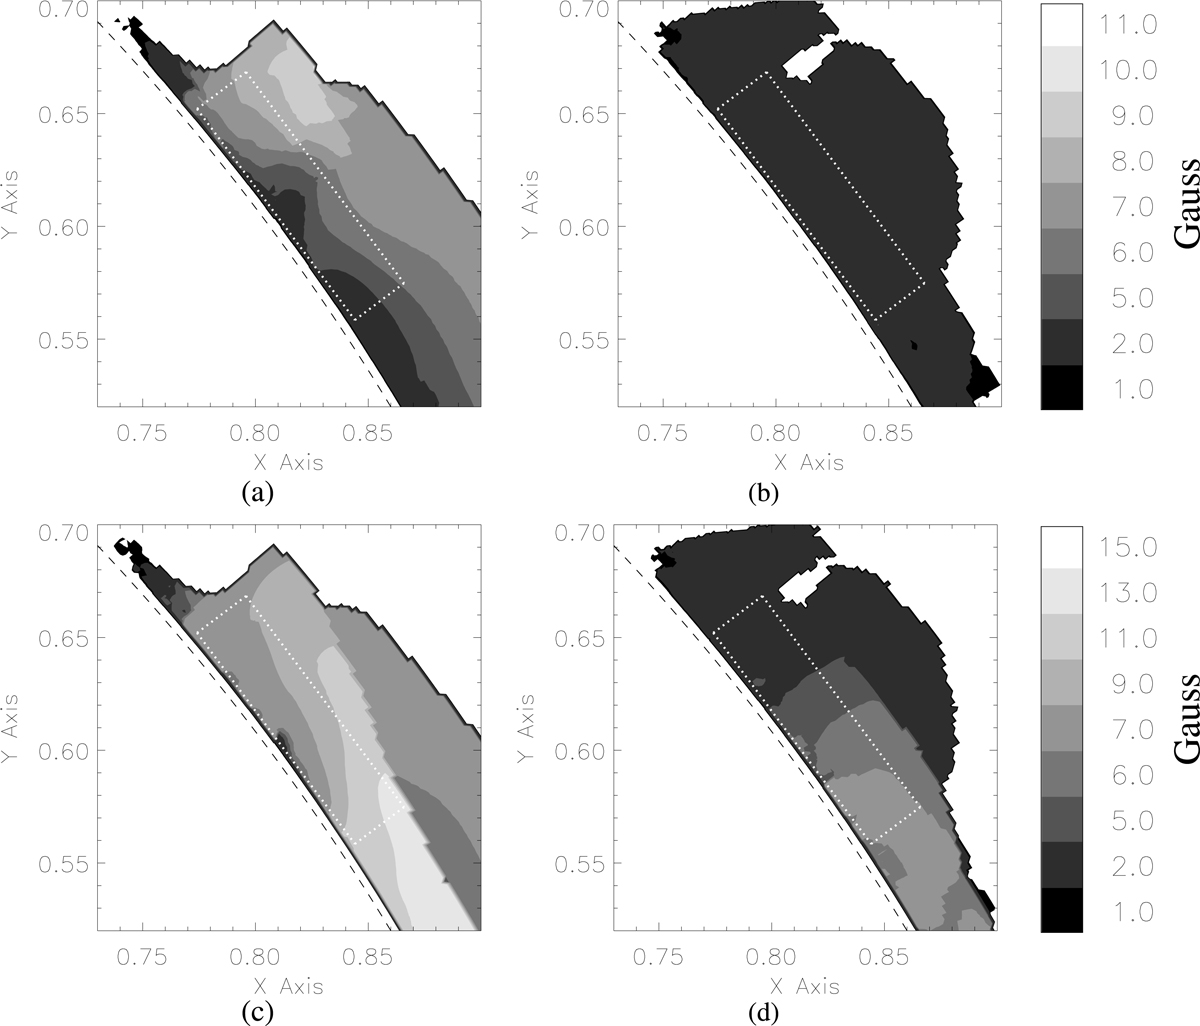
Properties of the dipped magnetic field regions for model 1 (left column) and model 2 (right column). In each plot the solar limb is shown by the dashed line. a and b: filled contour plots for the line-of-sight average of ∣B∣. c and d: filled contour plots for the peak value of the magnetic field along the line of sight. For each of the contour plots the colour bar at the right-hand side gives the contour levels.
Current usage metrics show cumulative count of Article Views (full-text article views including HTML views, PDF and ePub downloads, according to the available data) and Abstracts Views on Vision4Press platform.
Data correspond to usage on the plateform after 2015. The current usage metrics is available 48-96 hours after online publication and is updated daily on week days.
Initial download of the metrics may take a while.