Fig. 8.
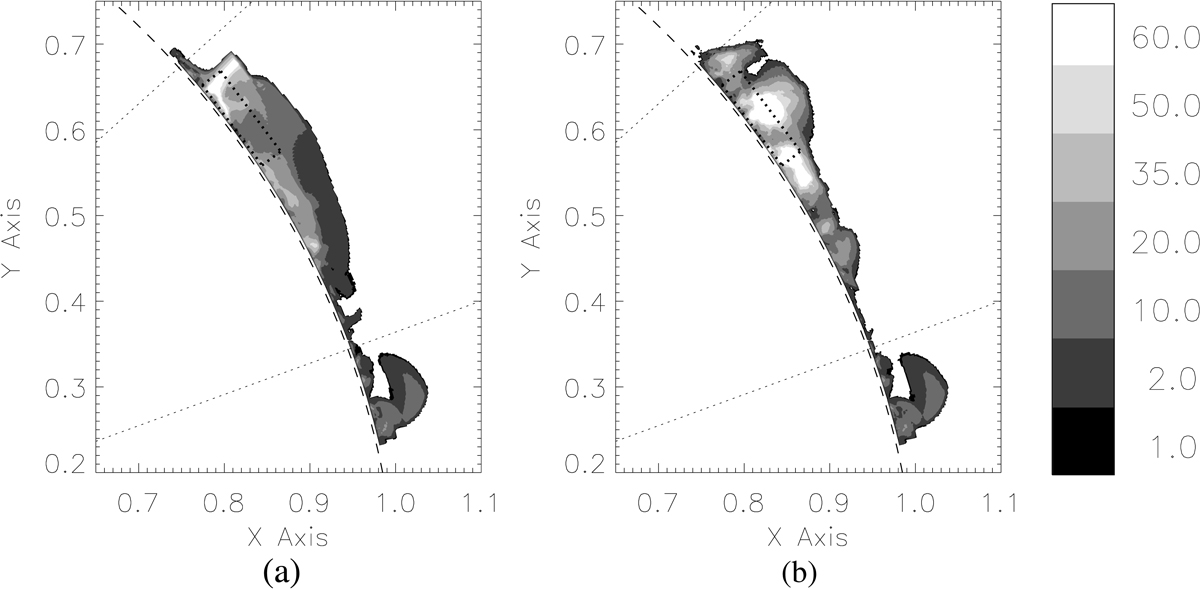
Filled contour plots for the number of dipped grid points along the line of sight for (a) model 1 and (b) model 2. In each plot the solar limb is shown by the dashed line, where the dotted lines denote the position angles at 290° and 312°. The black dashed box denotes the THEMIS/MTR field of view. For each of the contour plots the colour bar at the right-hand side gives the contour levels for the number of grid points.
Current usage metrics show cumulative count of Article Views (full-text article views including HTML views, PDF and ePub downloads, according to the available data) and Abstracts Views on Vision4Press platform.
Data correspond to usage on the plateform after 2015. The current usage metrics is available 48-96 hours after online publication and is updated daily on week days.
Initial download of the metrics may take a while.