Fig. 6.
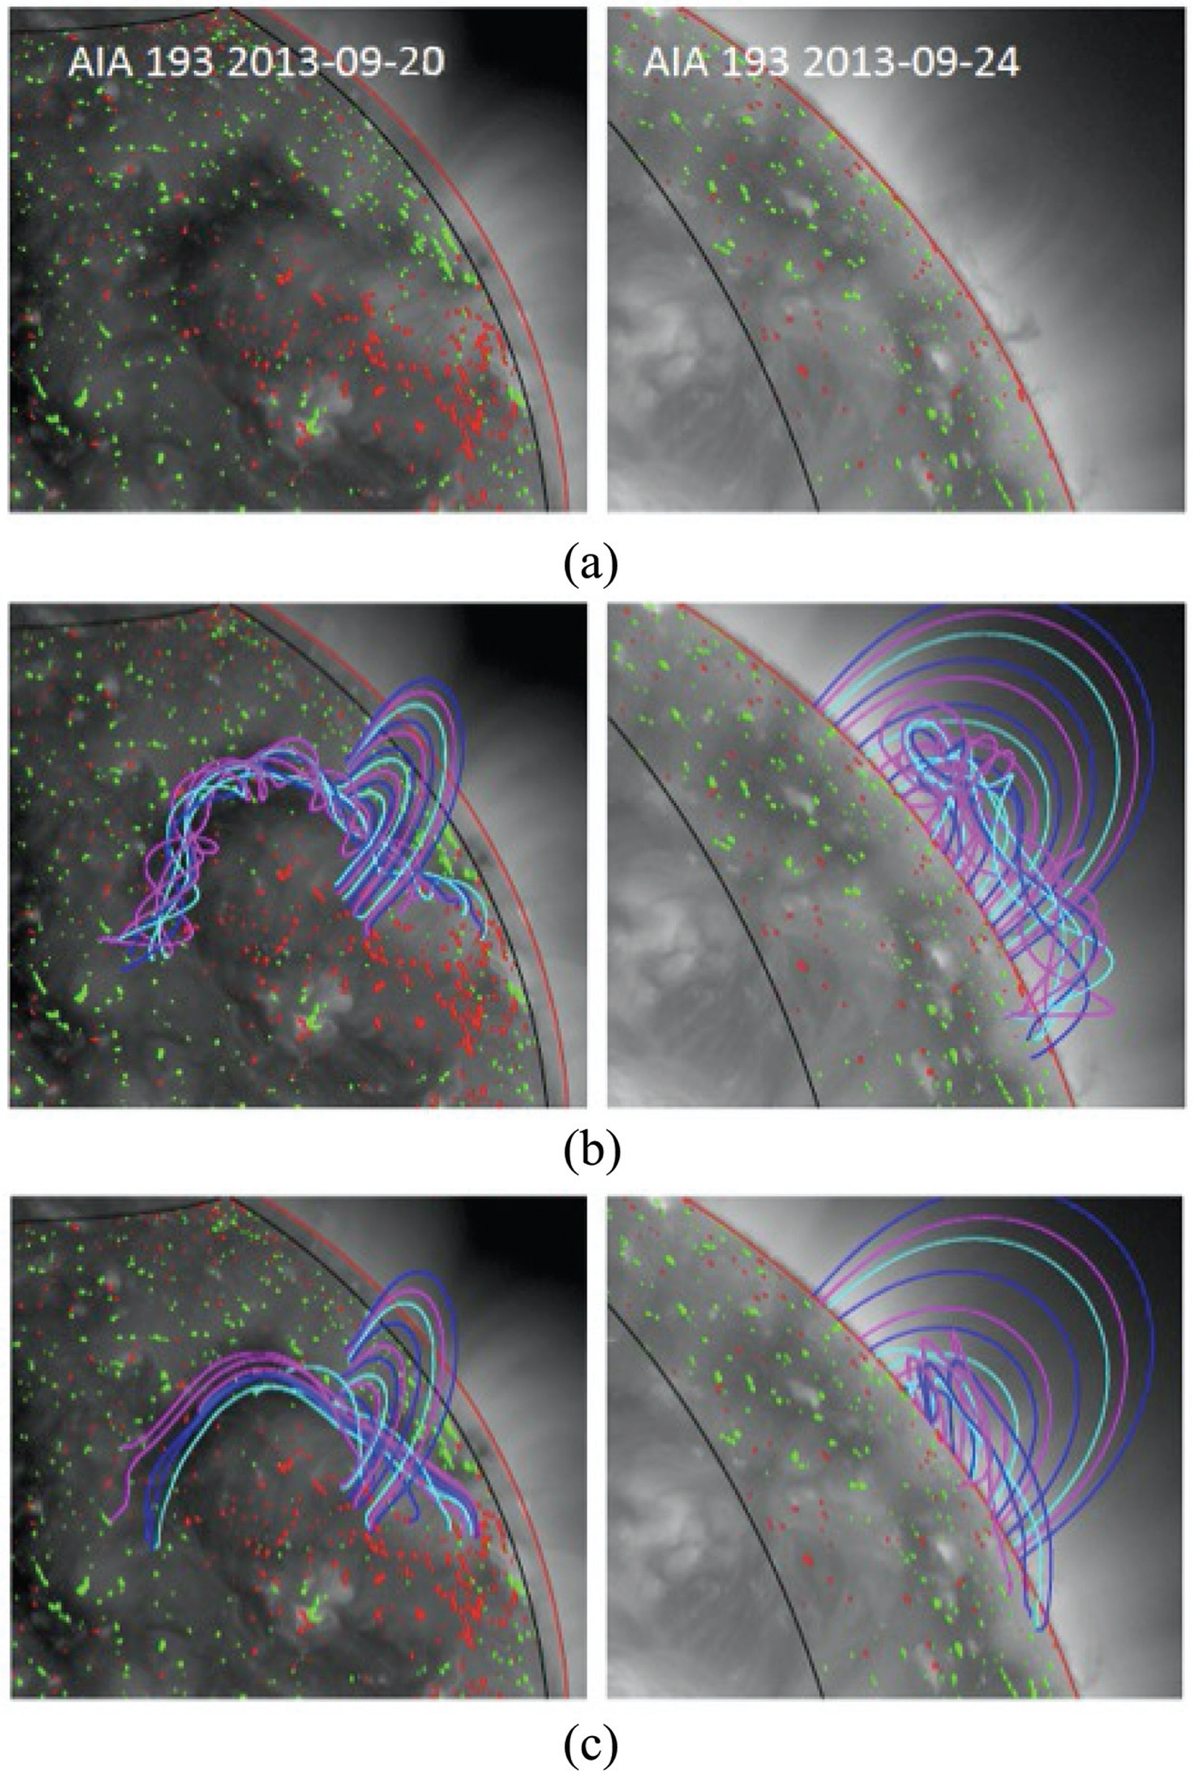
Comparison of (a) AIA 193 Å images with (b) model 1 and (c) model 2 for September 20, 2013 (left column) and September 24, 2013 (right column). In each image the red line denotes the solar limb, and the black line denotes the computational domain. In all of the images the underlying photospheric magnetic field is shown as the red and green contours.
Current usage metrics show cumulative count of Article Views (full-text article views including HTML views, PDF and ePub downloads, according to the available data) and Abstracts Views on Vision4Press platform.
Data correspond to usage on the plateform after 2015. The current usage metrics is available 48-96 hours after online publication and is updated daily on week days.
Initial download of the metrics may take a while.