Fig. 5.
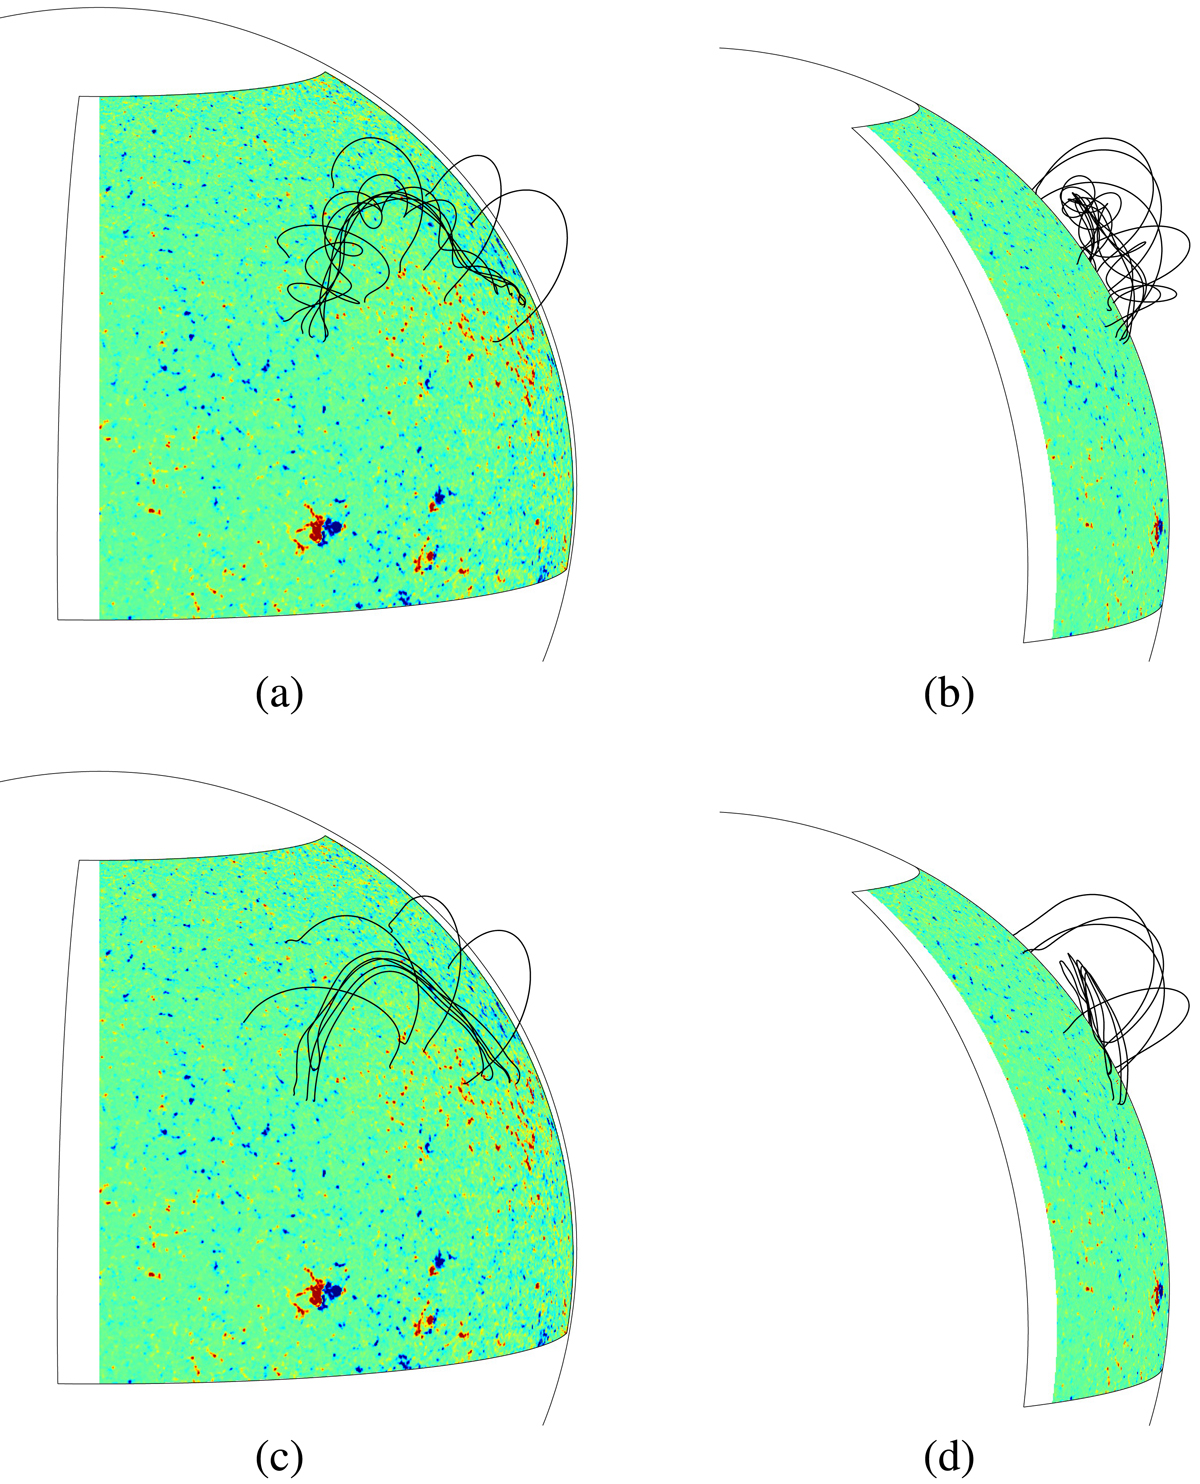
Illustration of the NLFFF from the flux rope insertion model of van Ballegooijen (2004). Magnetic field constructed on September 20, 2013, 12:00 UT for (a) model 1 and (c) model 2. The solid-body rotation of the constructed NLFFF to September 24, 2013, 12:00 UT is shown for (b) model 1 and (d) model 2. In each plot the thin black lines denote the solar limb and the area of the high-resolution computational box, and the thick black lines denote field lines. The colour image illustrates the photospheric magnetic field distribution. Red and blue denote positive and negative flux.
Current usage metrics show cumulative count of Article Views (full-text article views including HTML views, PDF and ePub downloads, according to the available data) and Abstracts Views on Vision4Press platform.
Data correspond to usage on the plateform after 2015. The current usage metrics is available 48-96 hours after online publication and is updated daily on week days.
Initial download of the metrics may take a while.