Fig. 7
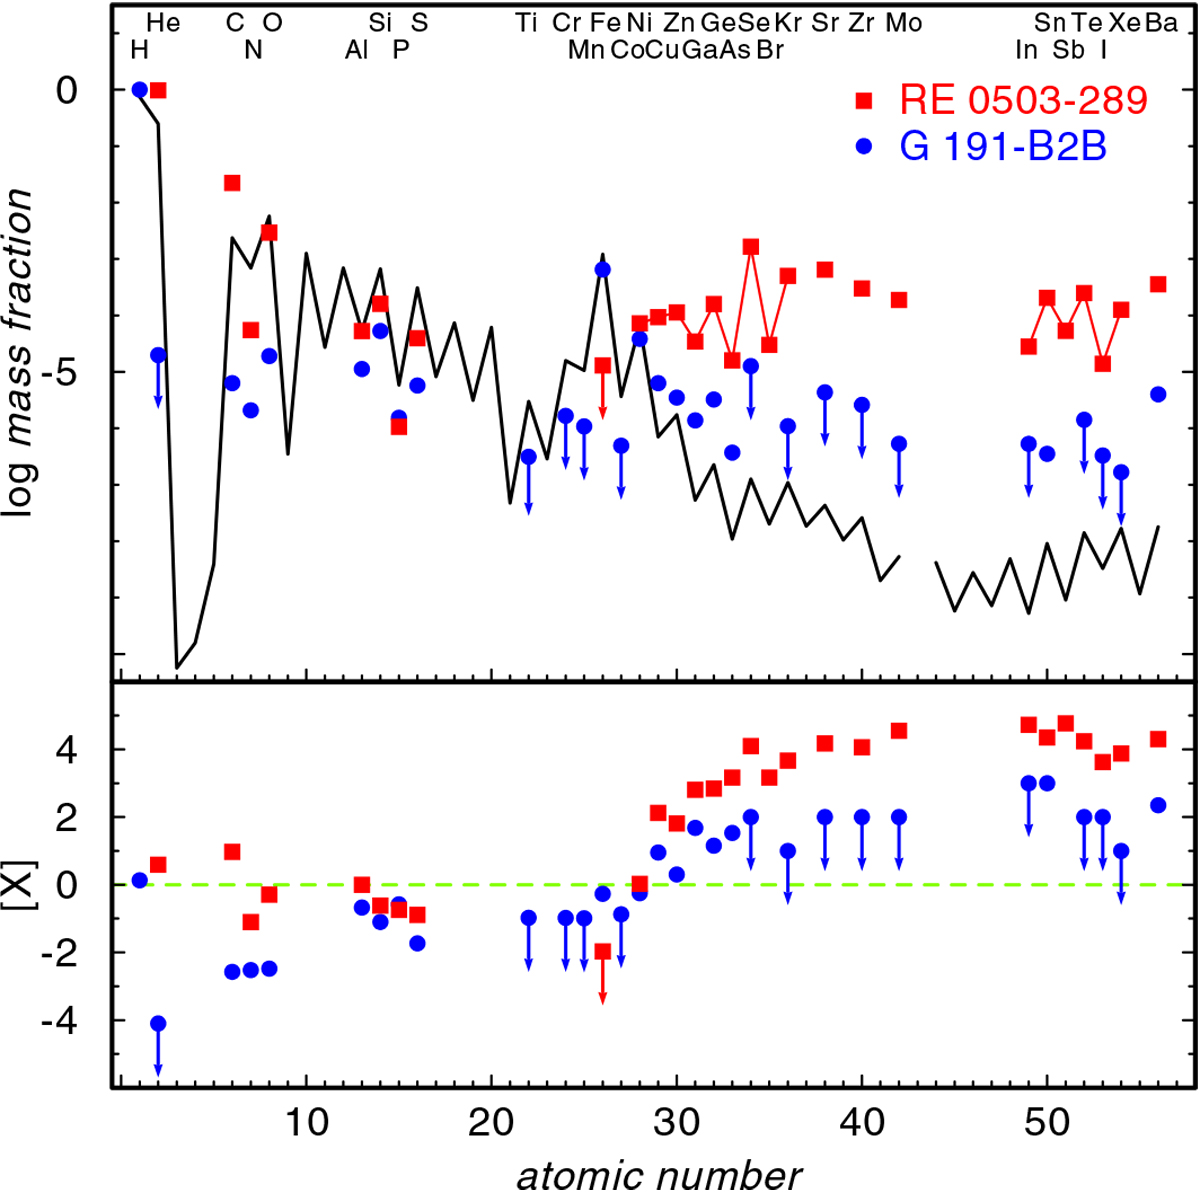
Solar abundances (Asplund et al. 2009; Scott et al. 2015b,a; Grevesse et al. 2015, thick black line) compared with the determined photospheric abundances of G191−B2B (blue circles, Rauch et al. 2013, and this work) and RE 0503−289 (red squares, Dreizler & Werner 1996; Rauch et al. 2012, 2014a,b, 2015b, 2016b,a, 2017a,b, and this work). The uncertainties of the abundances are about 0.2 dex in general. Arrows indicate upper limits. Top panel: abundances given as logarithmic mass fractions. Determined TIE abundances of subsequent species are combined with lines. Bottom panel: abundance ratios to respective solar values, [X] denotes log (fraction / solar fraction) of species X. The dashed green line indicates solar abundances.
Current usage metrics show cumulative count of Article Views (full-text article views including HTML views, PDF and ePub downloads, according to the available data) and Abstracts Views on Vision4Press platform.
Data correspond to usage on the plateform after 2015. The current usage metrics is available 48-96 hours after online publication and is updated daily on week days.
Initial download of the metrics may take a while.