Free Access
Fig. 6
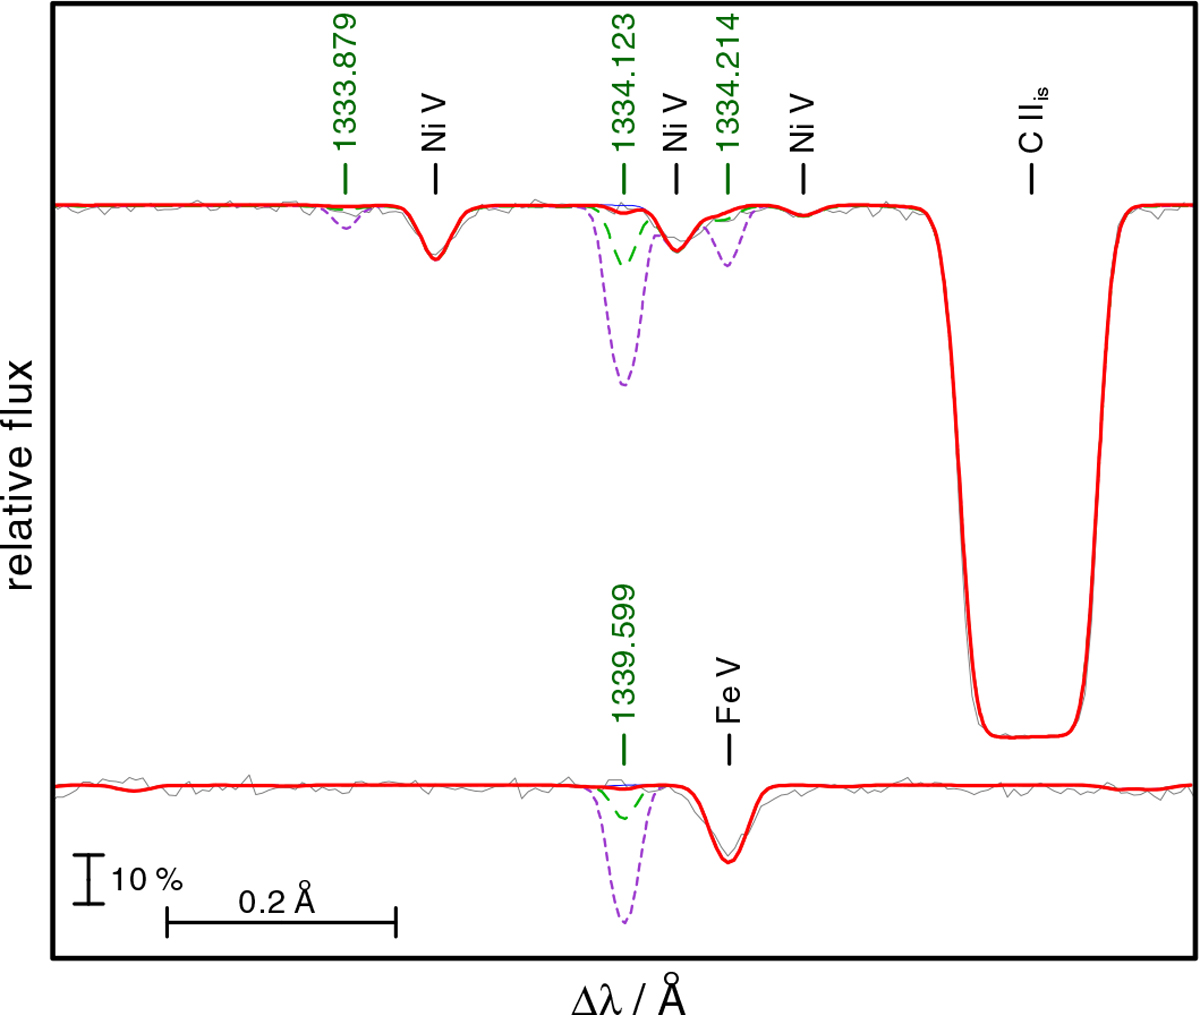
STIS observation of G191−B2B (gray) compared with synthetic line profiles of In V λ 1334.123 Å and In V λ 1339.599 Å calculated with four In abundances: without (thin blue line), with 1000 times (thick red), 10 000 times (short-dashed violet), and 100 000 times solar abundance (long-dashed green).
Current usage metrics show cumulative count of Article Views (full-text article views including HTML views, PDF and ePub downloads, according to the available data) and Abstracts Views on Vision4Press platform.
Data correspond to usage on the plateform after 2015. The current usage metrics is available 48-96 hours after online publication and is updated daily on week days.
Initial download of the metrics may take a while.