Fig. 3
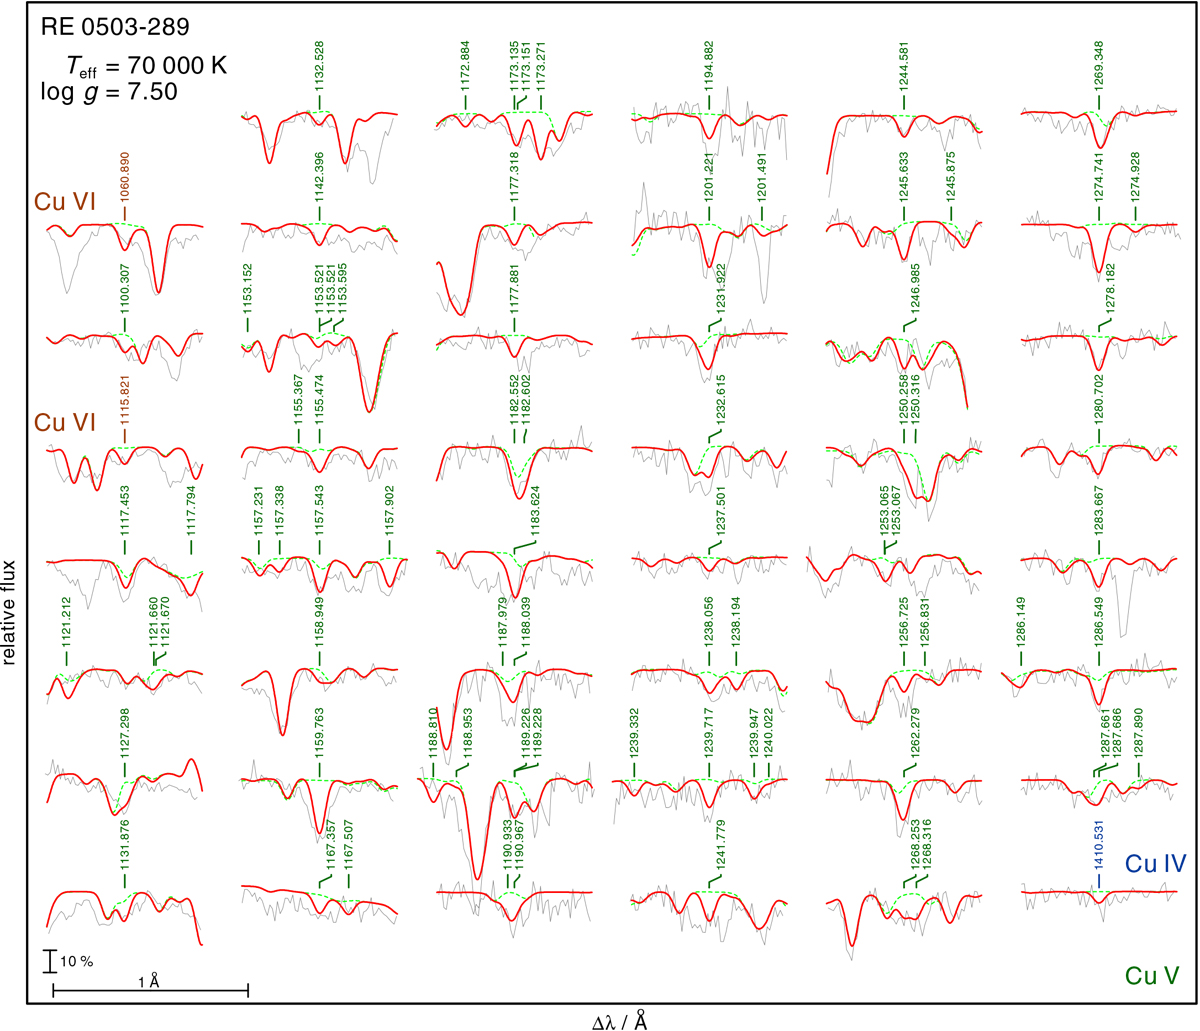
Prominent Cu lines in the observation (gray line) of RE 0503−289, labeled with their wavelengths from Tables A.13, A.14, and A.15. Cu VI λλ 1060.890, 1100.307Å, and Cu IV λ 1410.531Å are indicated with an additional ion label, all other lines stem from Cu V. For the identification of other lines that are visible in the spectrum, please visit http://astro.uni-tuebingen.de/~TVIS/objects/RE0503-289, our Tübingen VISualization Tool (TVIS). The thick red spectrum is calculated from our best model with a Cu mass fraction of 9.3 × 10⁻⁵. The dashed green line shows a synthetic spectrum calculated without Cu. The vertical bar indicates 10% of the continuum flux.
Current usage metrics show cumulative count of Article Views (full-text article views including HTML views, PDF and ePub downloads, according to the available data) and Abstracts Views on Vision4Press platform.
Data correspond to usage on the plateform after 2015. The current usage metrics is available 48-96 hours after online publication and is updated daily on week days.
Initial download of the metrics may take a while.