Fig. H.20
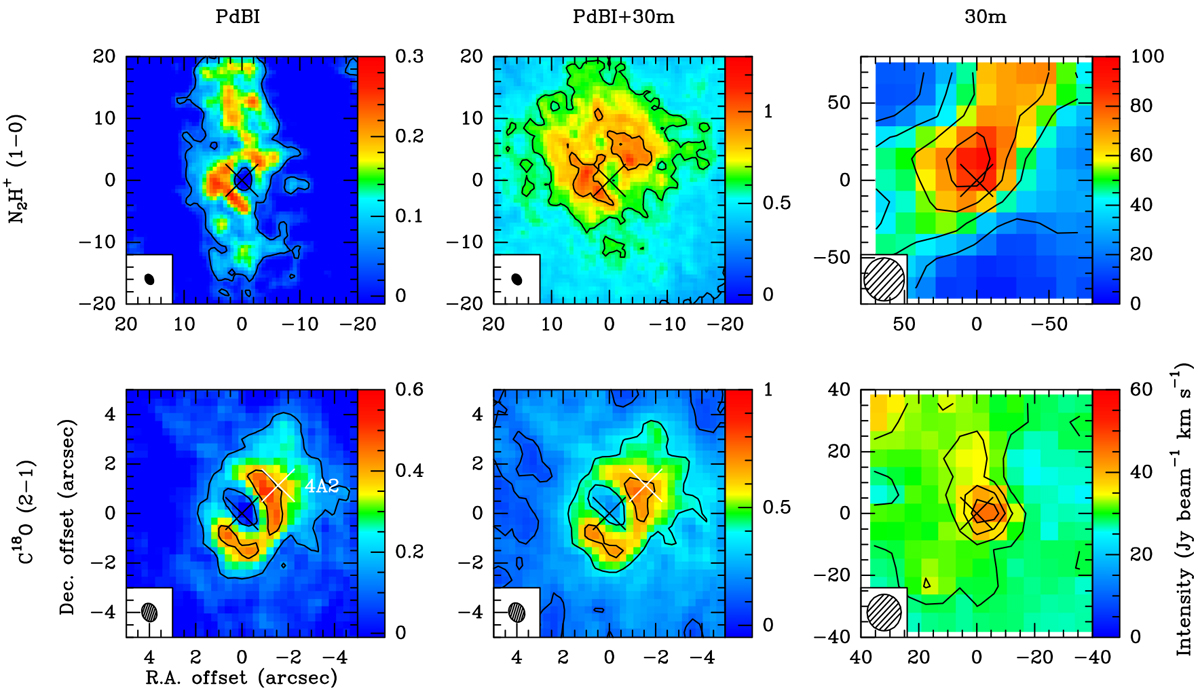
Same as Fig. 1, but for IRAS4A. The white cross represents the position of secondary protostar IRAS4A2 determined from the 1.3 mm dust continuum emission (see Table 1). The black cross represents the position of the main protostar IRAS4A1 of the multiple system. The black lines represent the integrated intensity contours of each tracer starting at 5σ and increasing in steps of 30σ for N2H+ and 10σ for C18O (see Tables B.3 and B.4.
Current usage metrics show cumulative count of Article Views (full-text article views including HTML views, PDF and ePub downloads, according to the available data) and Abstracts Views on Vision4Press platform.
Data correspond to usage on the plateform after 2015. The current usage metrics is available 48-96 hours after online publication and is updated daily on week days.
Initial download of the metrics may take a while.