Fig. H.2
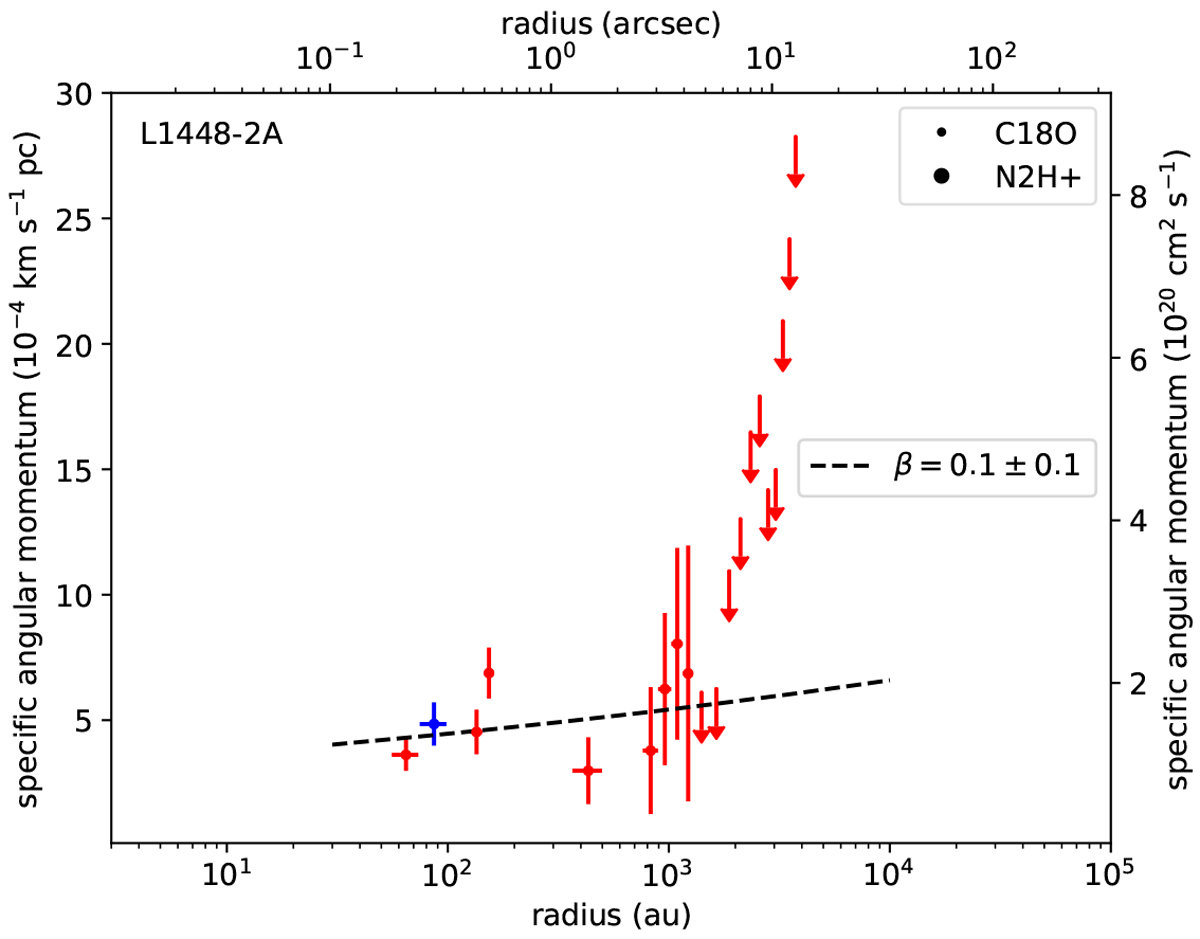
Radial distribution of specific angular momentum along the equatorial axis for L1448-2A. Blue and red dots show the blue- and red-shifted rotational velocities, respectively. Dots and large dots show points from C18O and N2H+ emission, respectively. The arrows display upper limits of j determined from velocity maps that do not exhibit a spatial distribution of velocities as organized as one would expect from rotation motions (see Sect. 4.3 and Appendix C). The dashed line shows the best least-square fitting with a power-law model leaving the index β as a free parameter (j ∝ rβ).
Current usage metrics show cumulative count of Article Views (full-text article views including HTML views, PDF and ePub downloads, according to the available data) and Abstracts Views on Vision4Press platform.
Data correspond to usage on the plateform after 2015. The current usage metrics is available 48-96 hours after online publication and is updated daily on week days.
Initial download of the metrics may take a while.