Fig. H.1
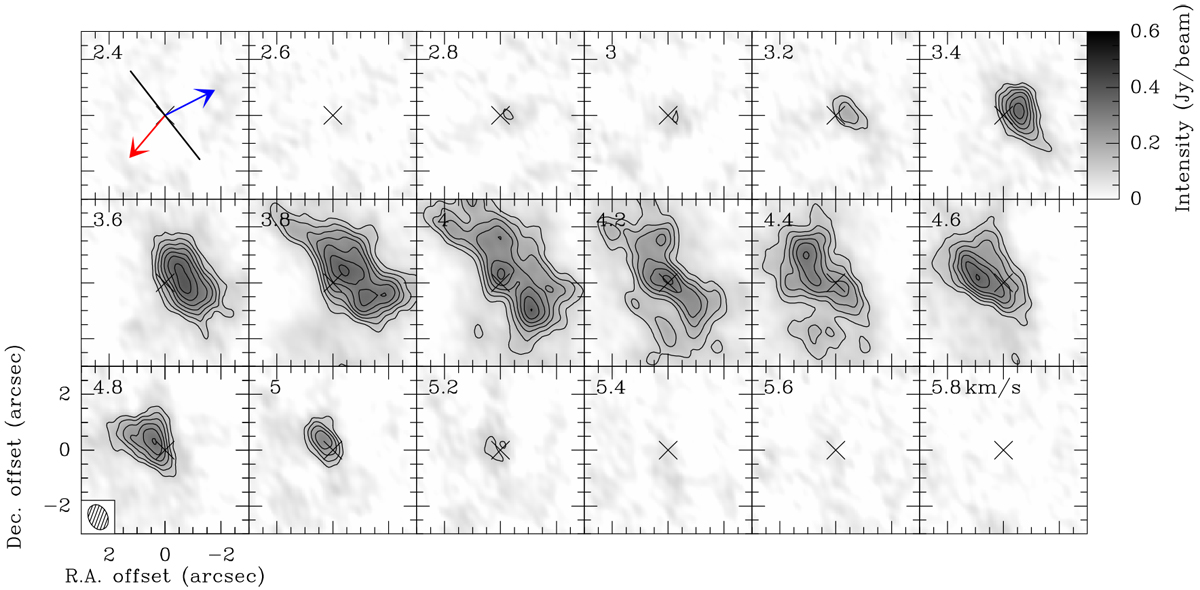
Channel maps of the C18O (2−1) emission from PdBI in L1448-2A. In the first panel, the outflow directions are shown by blue and red solid arrows and the equatorial axis is represented by a solid black line. The clean beam is shown by an ellipse on the bottom left. Contours are drawn in black solid lines at 5σ, 7σ and so on. The systemic velocity is estimated to be vsys = 4.0 km s−1 (see Table E.2).
Current usage metrics show cumulative count of Article Views (full-text article views including HTML views, PDF and ePub downloads, according to the available data) and Abstracts Views on Vision4Press platform.
Data correspond to usage on the plateform after 2015. The current usage metrics is available 48-96 hours after online publication and is updated daily on week days.
Initial download of the metrics may take a while.