Fig. 20
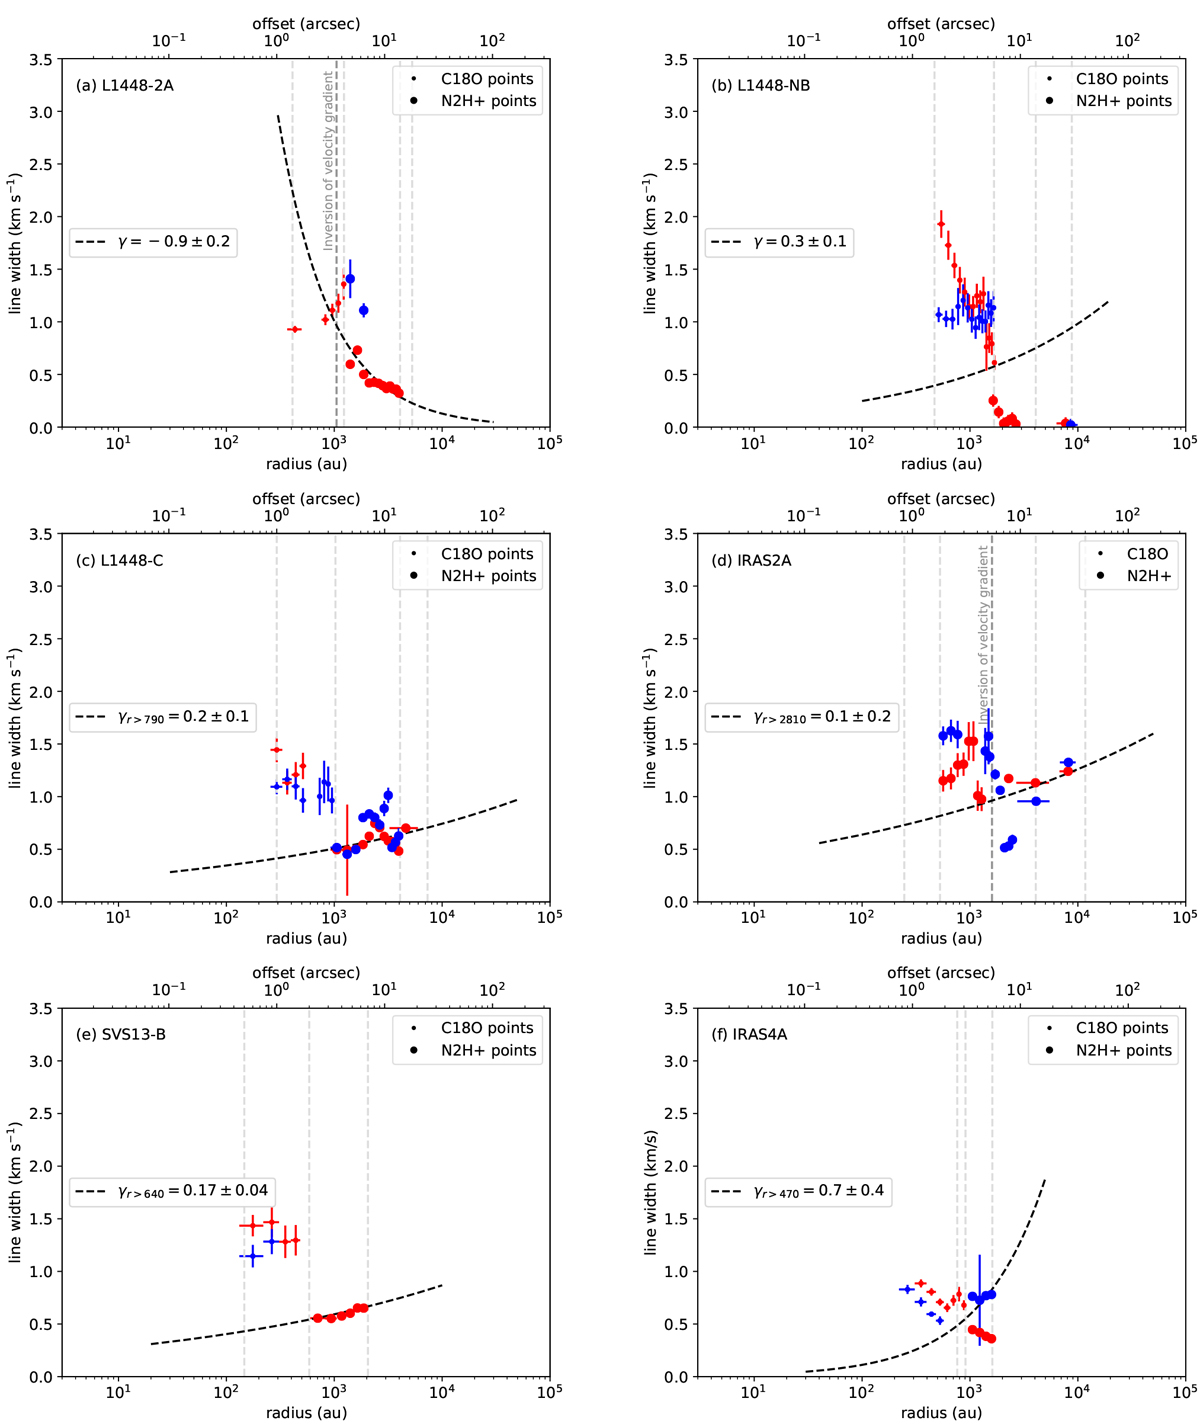
Linewidth along the equatorial axis of the CALYPSO protostellar envelopes. Blue and red dots show the linewidths at positions that have blue- and red-shifted velocities, respectively. Dots and large dots show the C18O and N2H+ data, respectively. The dashed curve shows the best fit with a power-law model leaving the index γ as a free parameter (Dv ∝ rγ) in the outer envelope (see Appendix G). The radius of the outer envelope is given by the break radius of the j(r) or japp (r) profiles (see Tables F.1 and F.2) or the radius where we observe a reversal of the velocity gradients with respect to the inner envelope. The vertical dashed lines show the transition radii between the different datasets (PdBI, combined, and 30m) and the two tracers as given in Table C.1.
Current usage metrics show cumulative count of Article Views (full-text article views including HTML views, PDF and ePub downloads, according to the available data) and Abstracts Views on Vision4Press platform.
Data correspond to usage on the plateform after 2015. The current usage metrics is available 48-96 hours after online publication and is updated daily on week days.
Initial download of the metrics may take a while.