Fig. 2
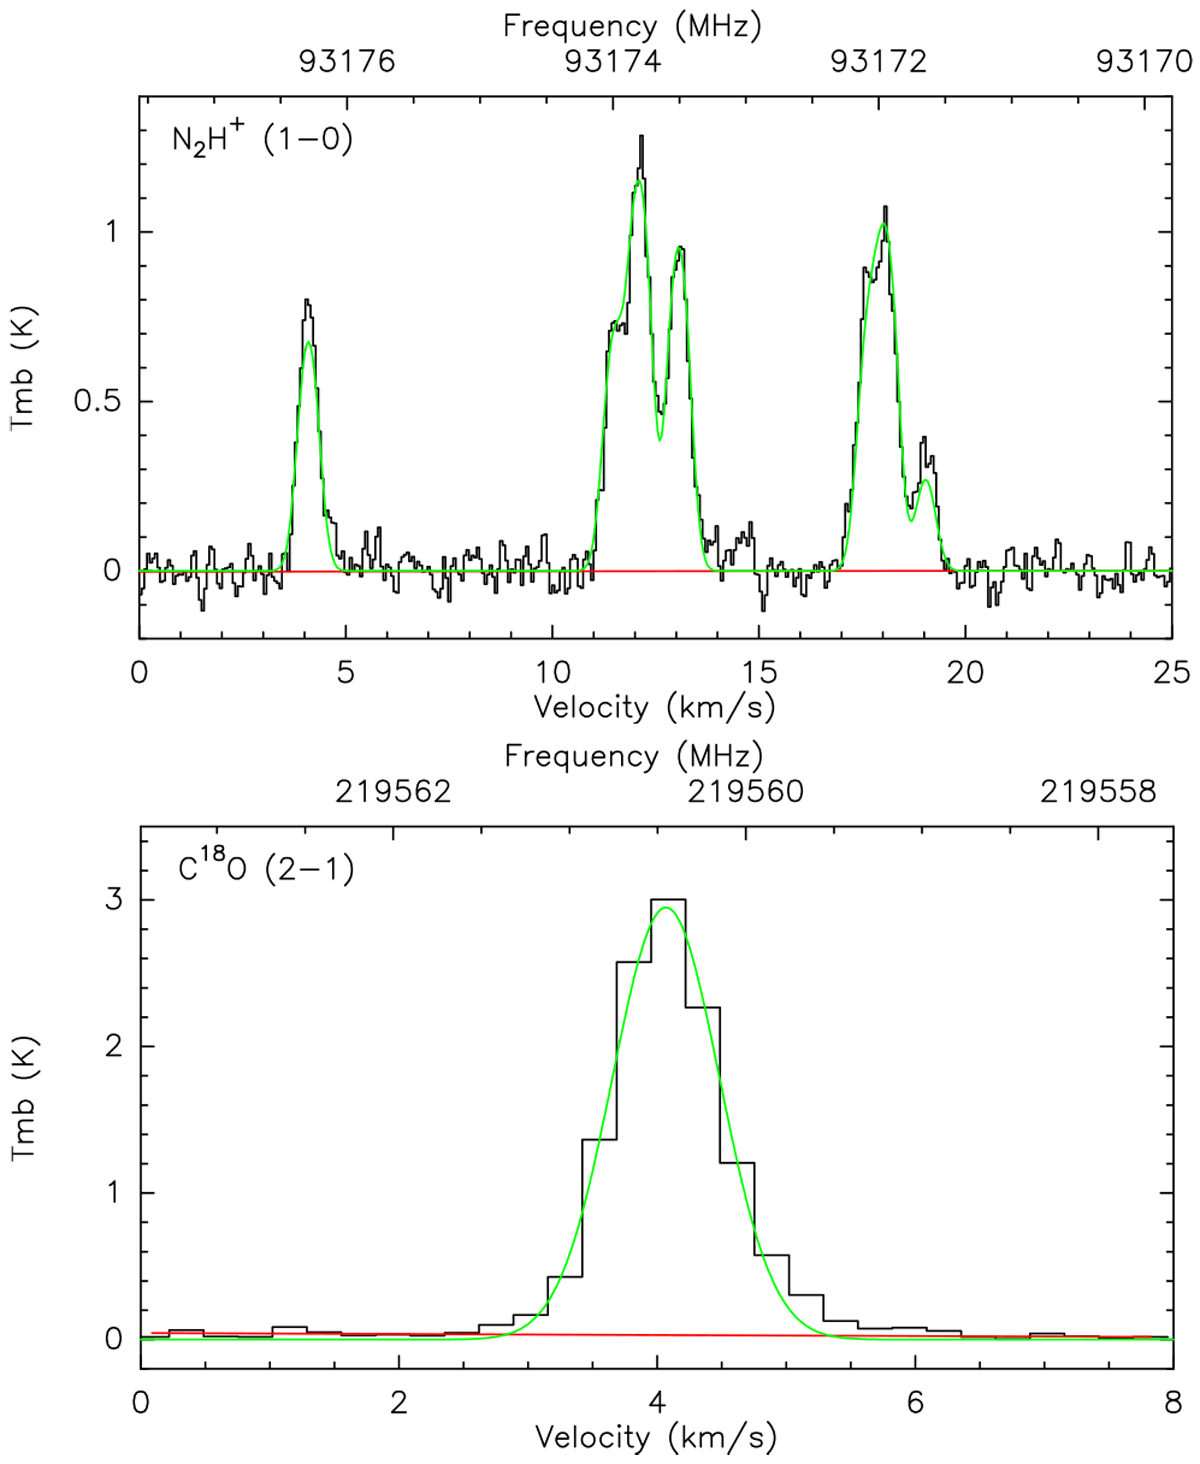
Mean spectra of the N2H+ (top) and C18O (bottom) molecular lines from the 30m datasets for L1448-2A. The best fits of the spectra, by a hyperfine structure and a Gaussian line profile models respectively, are represented in green solid lines. Top panel: the velocity axis corresponds to the isolated HFS component 101 − 012. The systemic velocity is estimated to be 4.10 km s−1 for this source (see Table E.1).
Current usage metrics show cumulative count of Article Views (full-text article views including HTML views, PDF and ePub downloads, according to the available data) and Abstracts Views on Vision4Press platform.
Data correspond to usage on the plateform after 2015. The current usage metrics is available 48-96 hours after online publication and is updated daily on week days.
Initial download of the metrics may take a while.