Fig. 19
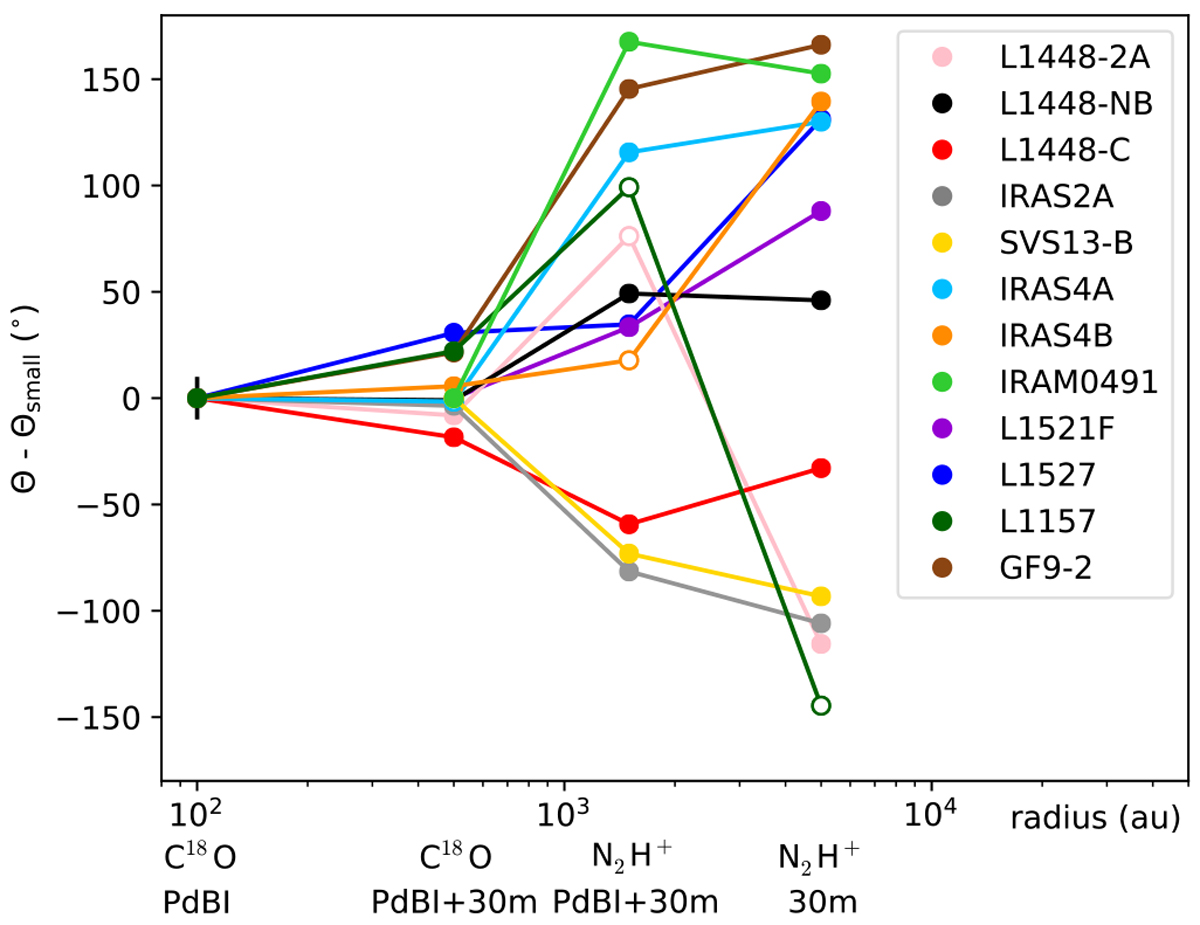
Evolution of the orientation of the mean velocity gradient in the different datasets used to build the PVrot diagrams and angular momentum distributions with respect to the PA of the velocity gradient observed at small scales Θsmall (PdBI C18O emission). The error bars of the orientation Θ are given in Table 2. They are smaller than 10° except for 7 of the 67 gradient measurements. For these 7 measurements, the large error bars are generally due to the absence of a clear gradient on either side of the central position of the source. Gradient measurements with large error are indicated by an empty circle. A typical error of ± 10° is shown on the first point of the plot.
Current usage metrics show cumulative count of Article Views (full-text article views including HTML views, PDF and ePub downloads, according to the available data) and Abstracts Views on Vision4Press platform.
Data correspond to usage on the plateform after 2015. The current usage metrics is available 48-96 hours after online publication and is updated daily on week days.
Initial download of the metrics may take a while.