Fig. 17
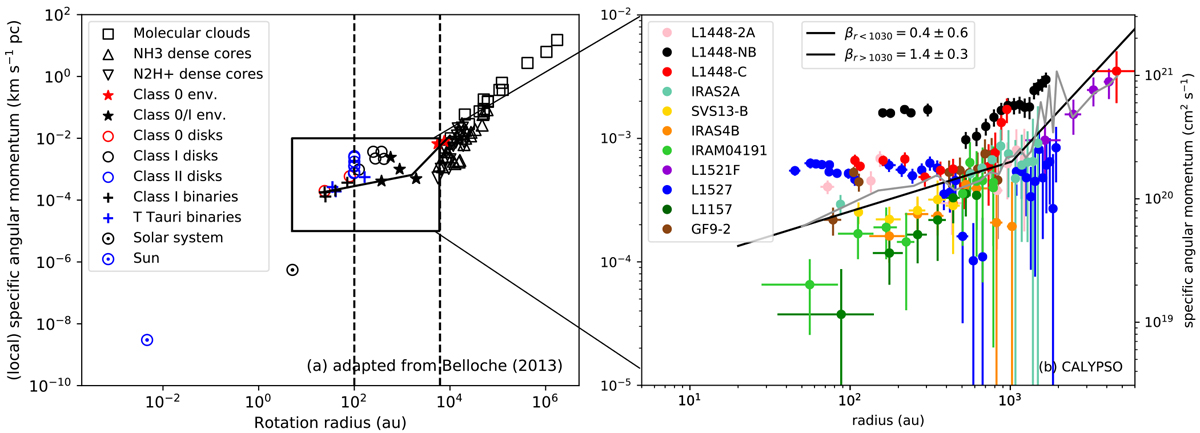
Radial distribution of specific angular momentum. Panel a: adapted from Fig. 8 of Belloche (2013) and from Ohashi et al. (1997a). Panel b: zoom on the region where the angular momentum profiles due to rotation of the CALYPSO sources lie. The gray curve shows the median profile j(r). In the two panels, the solid black line shows the best fit with a broken power-law model.
Current usage metrics show cumulative count of Article Views (full-text article views including HTML views, PDF and ePub downloads, according to the available data) and Abstracts Views on Vision4Press platform.
Data correspond to usage on the plateform after 2015. The current usage metrics is available 48-96 hours after online publication and is updated daily on week days.
Initial download of the metrics may take a while.