Fig. 16
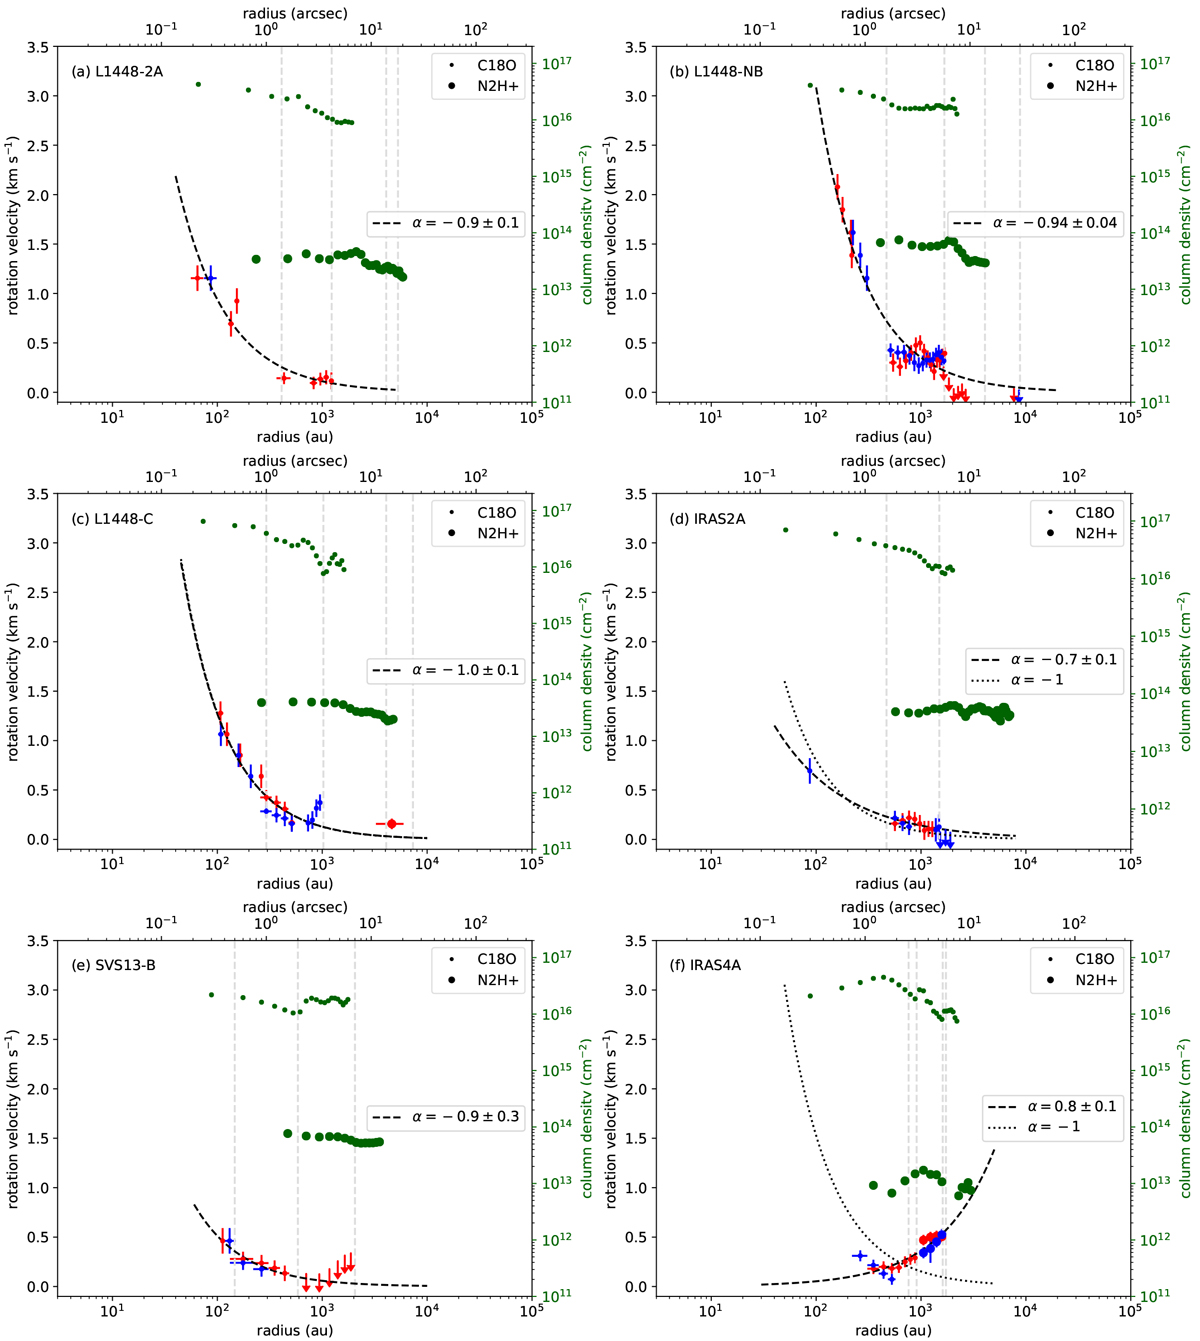
Position-velocity diagram along the equatorial axis of the CALYPSO protostellar envelopes. Blue and red dots show the blue- and red-shifted velocities, respectively. The arrows display the upper limits of vrot determined from velocity maps that do not exhibit a spatial distribution of velocities as organized as one wouldexpect from rotation motions (see Sect. 4.3 and Appendix C). Green dots show the column density profiles along the equatorial axis. Dots and large dots show the C18O and N2H+ data, respectively. The dashed curve shows the best fit with a power-law model leaving the index α as a free parameter (vrot ∝ rα) whereas the dotted curve shows the best fit with a power-law model with a fixed index α = −1. The verticaldashed lines show the transition radii between the different datasets (PdBI, combined, and 30m) and the two tracers as illustrated in Fig. 15 and given in Table C.1.
Current usage metrics show cumulative count of Article Views (full-text article views including HTML views, PDF and ePub downloads, according to the available data) and Abstracts Views on Vision4Press platform.
Data correspond to usage on the plateform after 2015. The current usage metrics is available 48-96 hours after online publication and is updated daily on week days.
Initial download of the metrics may take a while.