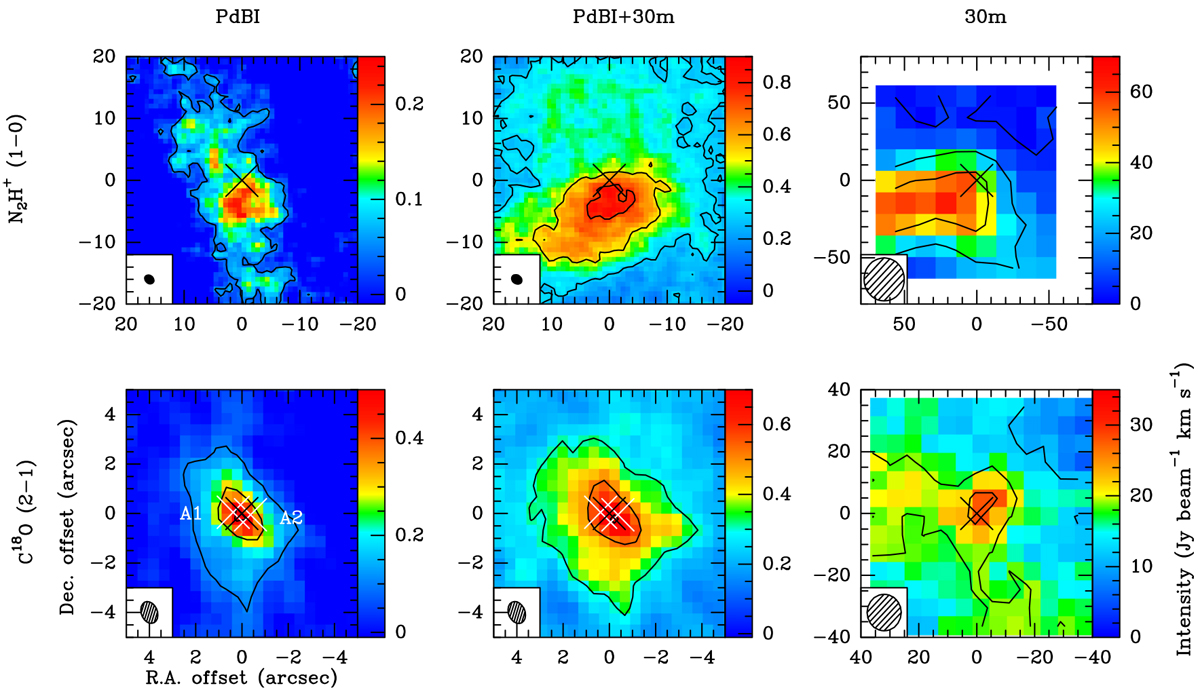
Fig. 1

Integrated intensity maps of N2H+ (1−0) (top) and C18O (2−1) (bottom) emission from the PdBI (left), combined (middle), and 30m (right) datasets for L1448-2A. The white crosses represent the positions of the binary system determined from the 1.3 mm dust continuum emission. The black cross represents the middle position between the binary system. The clean beam is shown by an ellipse on the bottom left of each map. The black lines represent the integrated intensity contours of each tracer starting at 5σ and increasing in steps of 25σ for N2H+ and 10σ for C18O (see Tables B.3 and B.4). Be careful, the spatial scales of the maps are not uniform in all panels.
Current usage metrics show cumulative count of Article Views (full-text article views including HTML views, PDF and ePub downloads, according to the available data) and Abstracts Views on Vision4Press platform.
Data correspond to usage on the plateform after 2015. The current usage metrics is available 48-96 hours after online publication and is updated daily on week days.
Initial download of the metrics may take a while.


