Fig. 8.
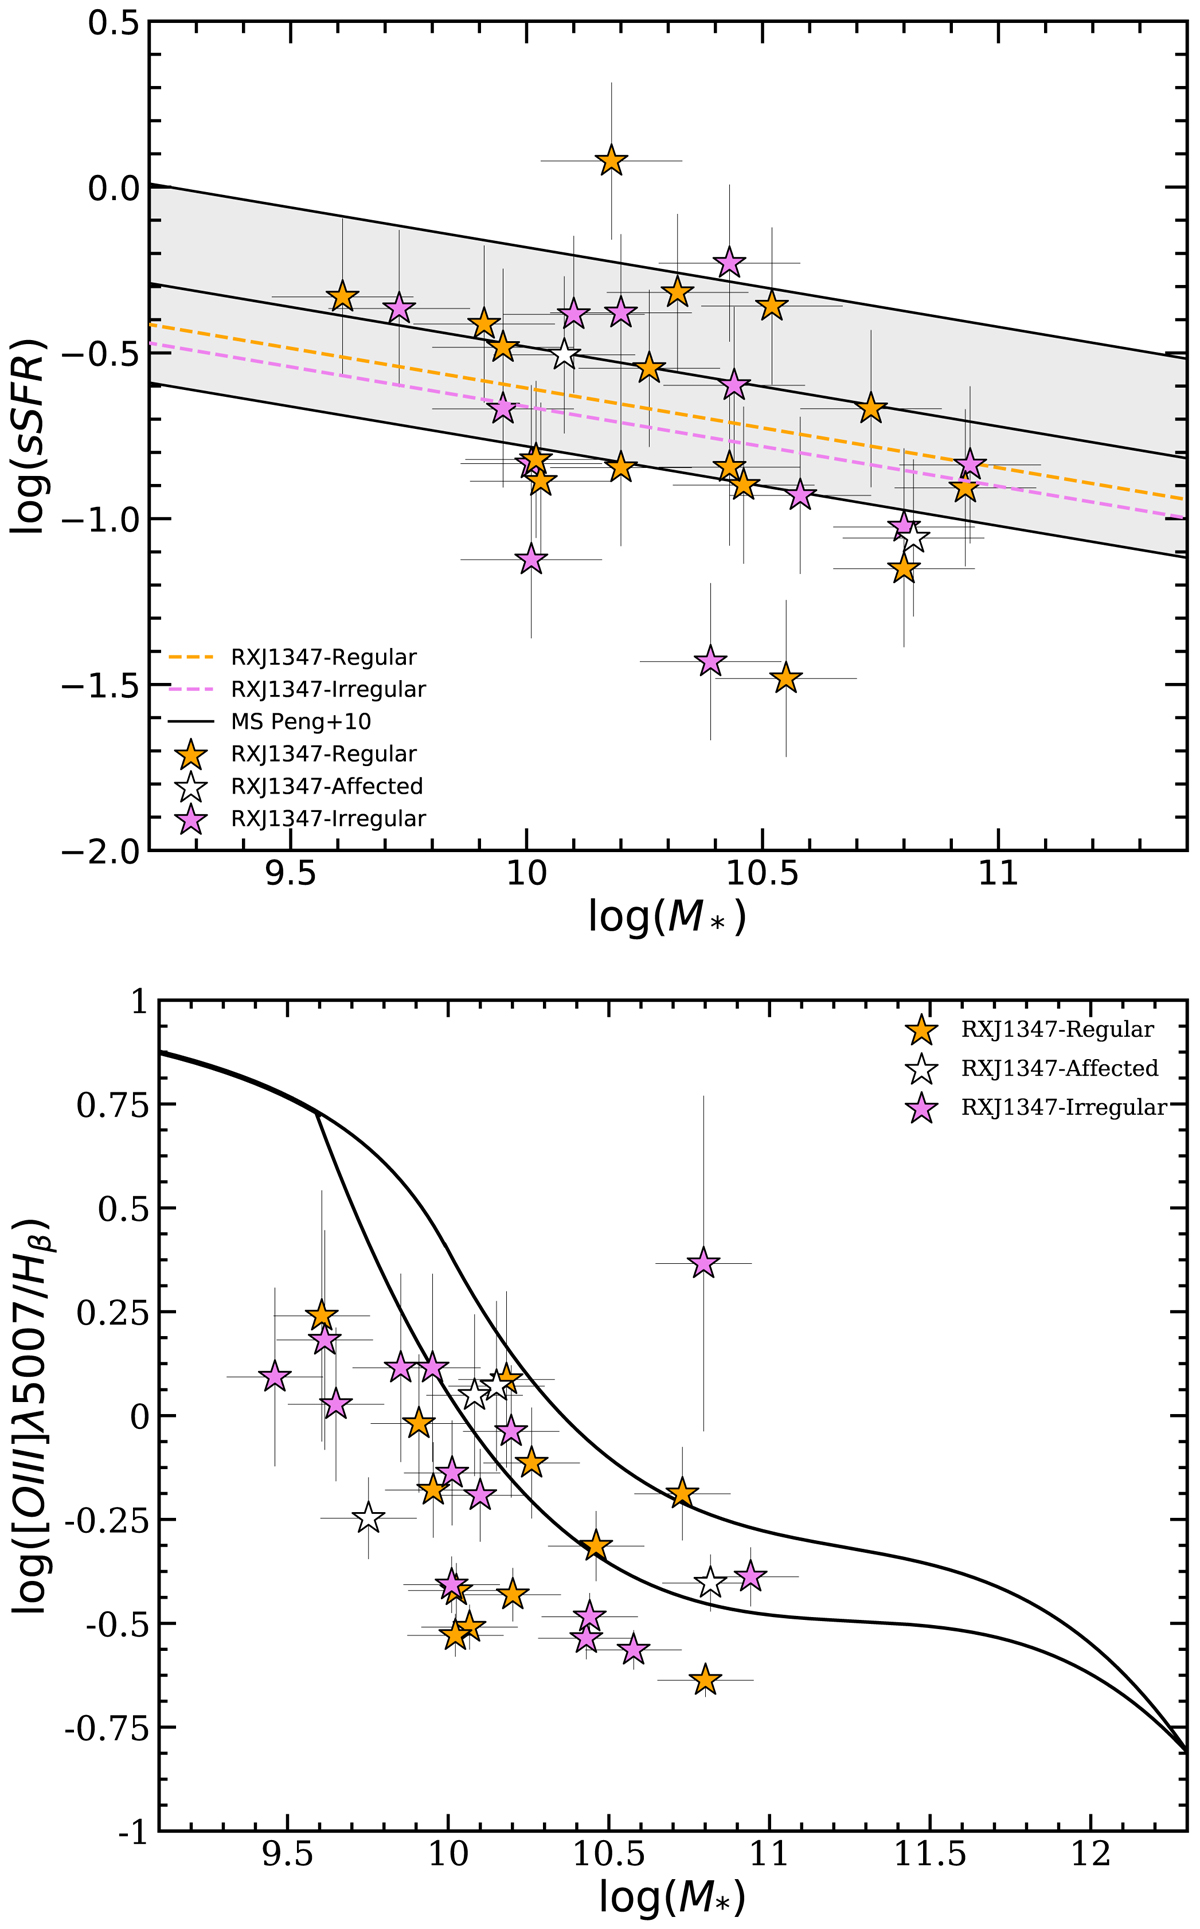
Top: sSFR−log(M*) diagram. Orange, white, and violet stars respectively represent cluster galaxies classified as regular, affected, and irregular according to their kinematic asymmetry index value (A). The black solid line shows the main sequence of star-forming galaxies at z ∼ 0.45 given by Peng et al. (2010) with a 3σ gray area region. The orange and violet dashed lines represent the best fit linear regressions to our sample of regular and irregular galaxies, respectively, assuming the slope given by the main sequence and a Chabrier IMF. Bottom: mass-excitation diagram (symbol shapes and colors as in the top panel). The diagram is divided into three different regions according to the dominating source of gas excitation: star-forming (bottom left), AGN (top right), and composite (central stripe).
Current usage metrics show cumulative count of Article Views (full-text article views including HTML views, PDF and ePub downloads, according to the available data) and Abstracts Views on Vision4Press platform.
Data correspond to usage on the plateform after 2015. The current usage metrics is available 48-96 hours after online publication and is updated daily on week days.
Initial download of the metrics may take a while.