Fig. 7.
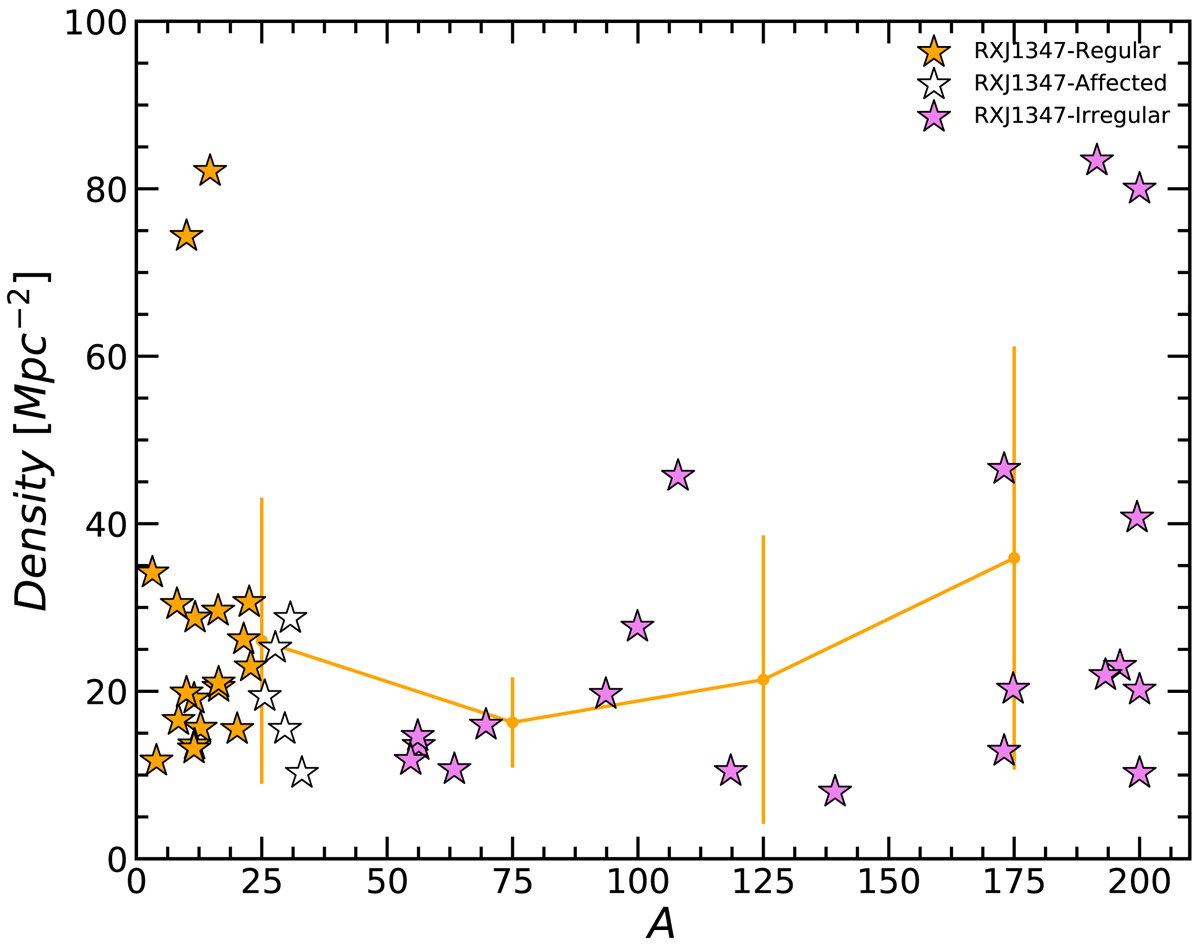
Galaxy number density of the area where our cluster objects lie (Verdugo et al. 2012) with respect to their asymmetry index. The orange, white, and violet stars represent regular, affected, and irregular cluster objects, respectively. The orange dots joined by lines of the same color show the mean values and standard deviation of our cluster sample divided into four bins according to their asymmetry index (A ≤ 50, 50 ≤ A ≤ 100, 100 ≤ A ≤ 150, and 150 ≤ A ≤ 200).
Current usage metrics show cumulative count of Article Views (full-text article views including HTML views, PDF and ePub downloads, according to the available data) and Abstracts Views on Vision4Press platform.
Data correspond to usage on the plateform after 2015. The current usage metrics is available 48-96 hours after online publication and is updated daily on week days.
Initial download of the metrics may take a while.