Fig. 6.
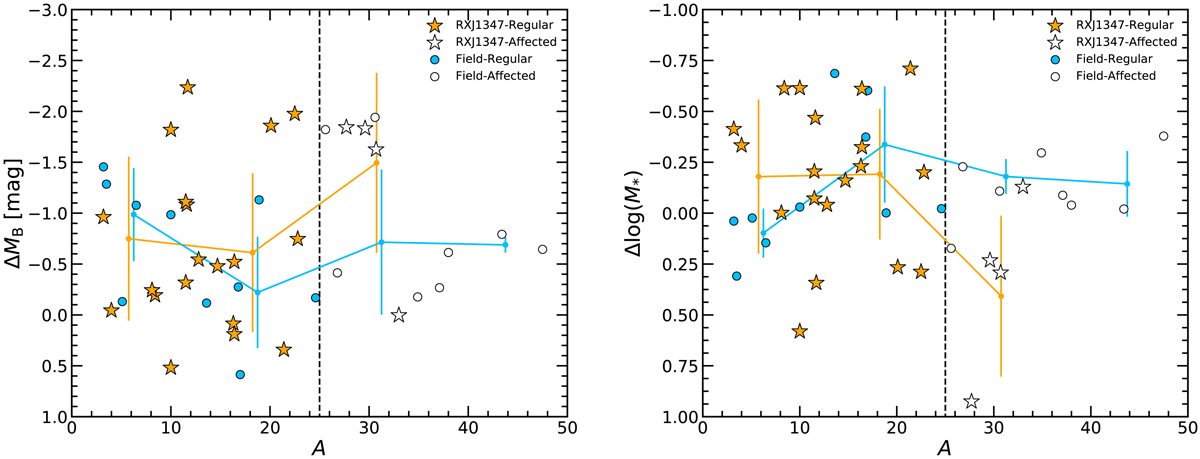
Left: B-band Tully–Fisher offsets compared to the asymmetry index values. Right: stellar-mass (M*) Tully–Fisher offsets compared to the asymmetry index values. In both diagrams the orange and white stars represent regular and affected cluster objects, respectively, while the blue and white circles represent regular and affected field galaxies. The orange and blue dots joined by lines of the same color show the mean values and standard deviation of our cluster and field sample divided into four bins according to their asymmetry index (A ≤ 12.5, 12.5 ≤ A ≤ 25, 25 ≤ A ≤ 37.5, and 37.5 ≤ A ≤ 50). The vertical dashed black line at A = 25 shows the limit between the kinematically regular and affected categories.
Current usage metrics show cumulative count of Article Views (full-text article views including HTML views, PDF and ePub downloads, according to the available data) and Abstracts Views on Vision4Press platform.
Data correspond to usage on the plateform after 2015. The current usage metrics is available 48-96 hours after online publication and is updated daily on week days.
Initial download of the metrics may take a while.