Fig. 5.
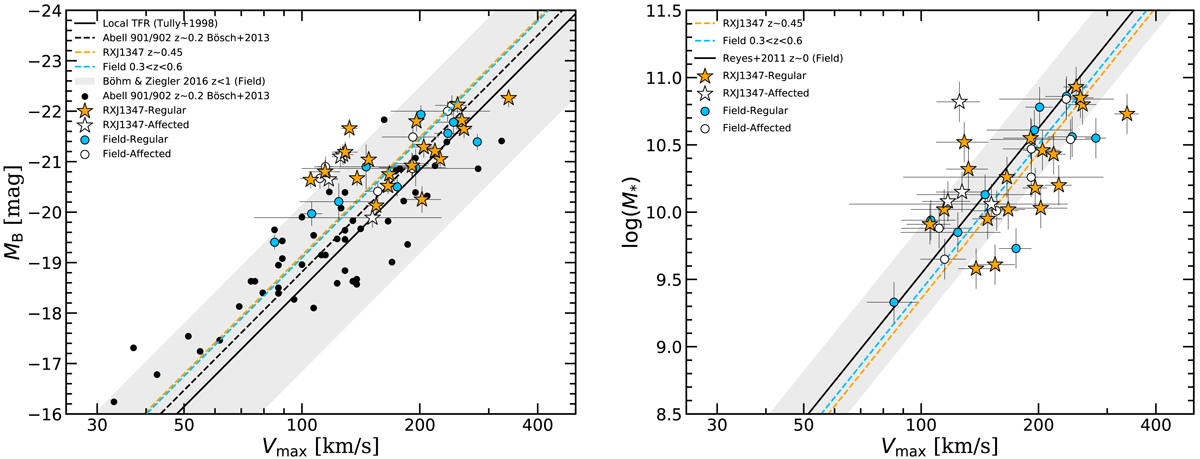
Left: Tully–Fisher B-band diagram. In both diagrams the orange and white stars represent regular and affected cluster objects, respectively, while the blue and white circles represent regular and affected field galaxies. Black circles represent cluster galaxies at z ∼ 0.2 from Bösch et al. (2013b). The solid black line shows the local B-band TFR (Tully et al. 1998) with a 3σ scatter area around reported by Böhm & Ziegler (2016) for galaxies at 0 < z < 1 (gray area). The orange, blue, and black dashed lines represent the best fit for the cluster and field sample of this study and the cluster sample from Bösch et al. (2013b), respectively. Right: stellar-mass Tully–Fisher diagram. The symbols and their colors follow the same description as in the left-hand panel. The solid black line shows the local M*-TFR from Reyes et al. (2011), with a 3σ scatter gray area around it.
Current usage metrics show cumulative count of Article Views (full-text article views including HTML views, PDF and ePub downloads, according to the available data) and Abstracts Views on Vision4Press platform.
Data correspond to usage on the plateform after 2015. The current usage metrics is available 48-96 hours after online publication and is updated daily on week days.
Initial download of the metrics may take a while.