Free Access
Fig. 3.
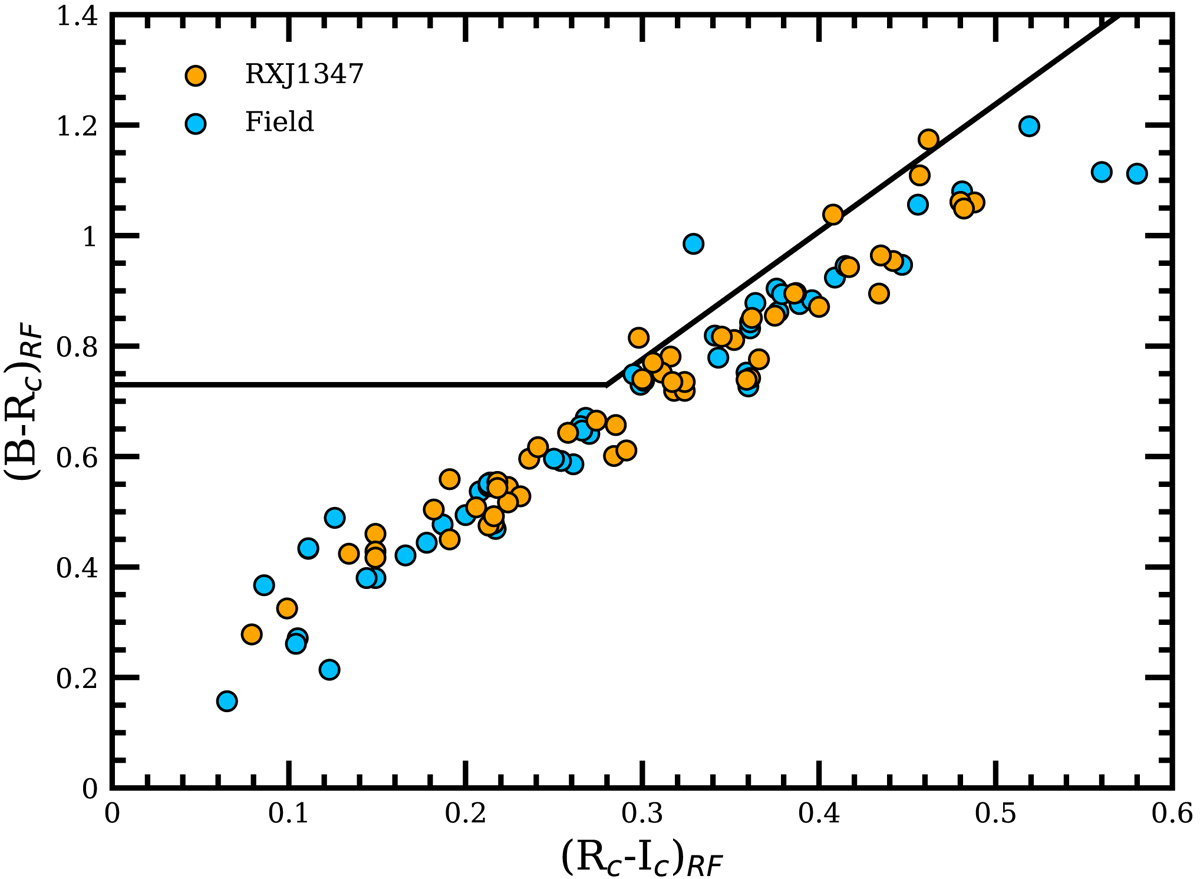
Color-color diagram for our cluster (orange) and field (blue) sample of galaxies. Both samples show very similar distributions in the star-forming region of the diagram with only a few galaxies in the exclusion (passive) area.
Current usage metrics show cumulative count of Article Views (full-text article views including HTML views, PDF and ePub downloads, according to the available data) and Abstracts Views on Vision4Press platform.
Data correspond to usage on the plateform after 2015. The current usage metrics is available 48-96 hours after online publication and is updated daily on week days.
Initial download of the metrics may take a while.