Fig. 2.
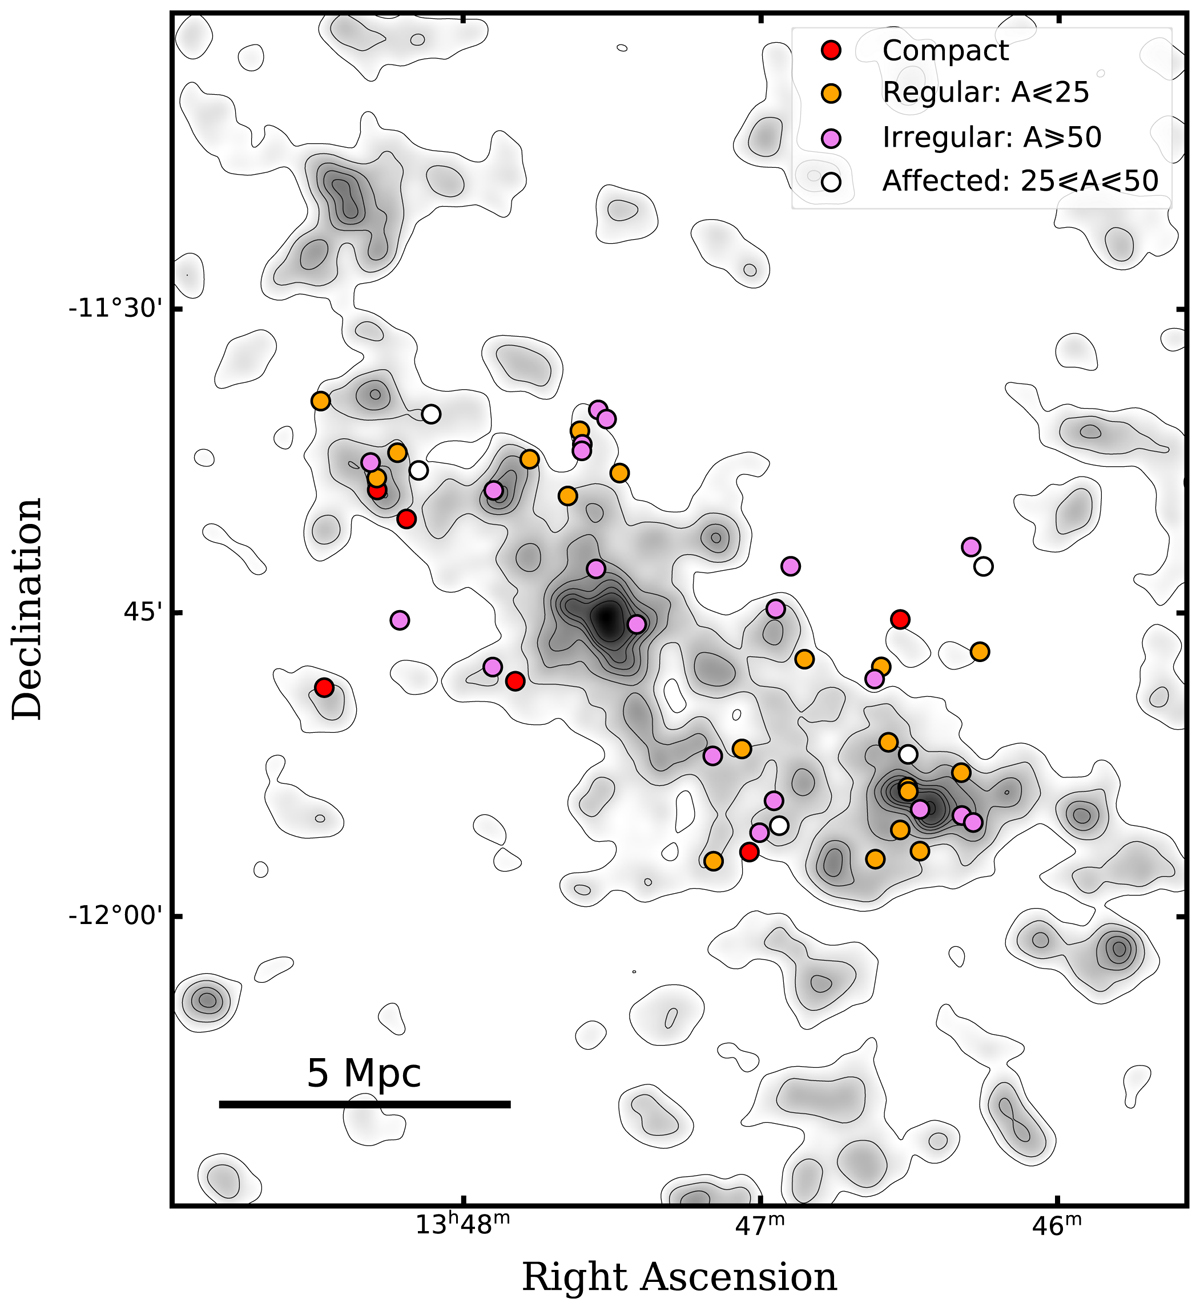
Spatial distribution of our cluster sample over the galaxy number density map shown in Verdugo et al. (2012) using the nearest-neighbor counting technique. The figure covers an approximate area of 50 × 50 arcmin2 around the center of the RXJ1347 cluster complex. Density contours start 1σ above the value of the general field at the redshift of the cluster, and gradually increase to 200 Mpc−1 in the inner regions of the cluster complex. The orange, purple, and white circles respectively indicate the galaxies classified as regular, irregular, and affected according to their gas kinematics (see Sect. 3.4). The red circles are galaxies with compact gas emission; these galaxies are not included in our kinematic analysis.
Current usage metrics show cumulative count of Article Views (full-text article views including HTML views, PDF and ePub downloads, according to the available data) and Abstracts Views on Vision4Press platform.
Data correspond to usage on the plateform after 2015. The current usage metrics is available 48-96 hours after online publication and is updated daily on week days.
Initial download of the metrics may take a while.