Fig. A.1.
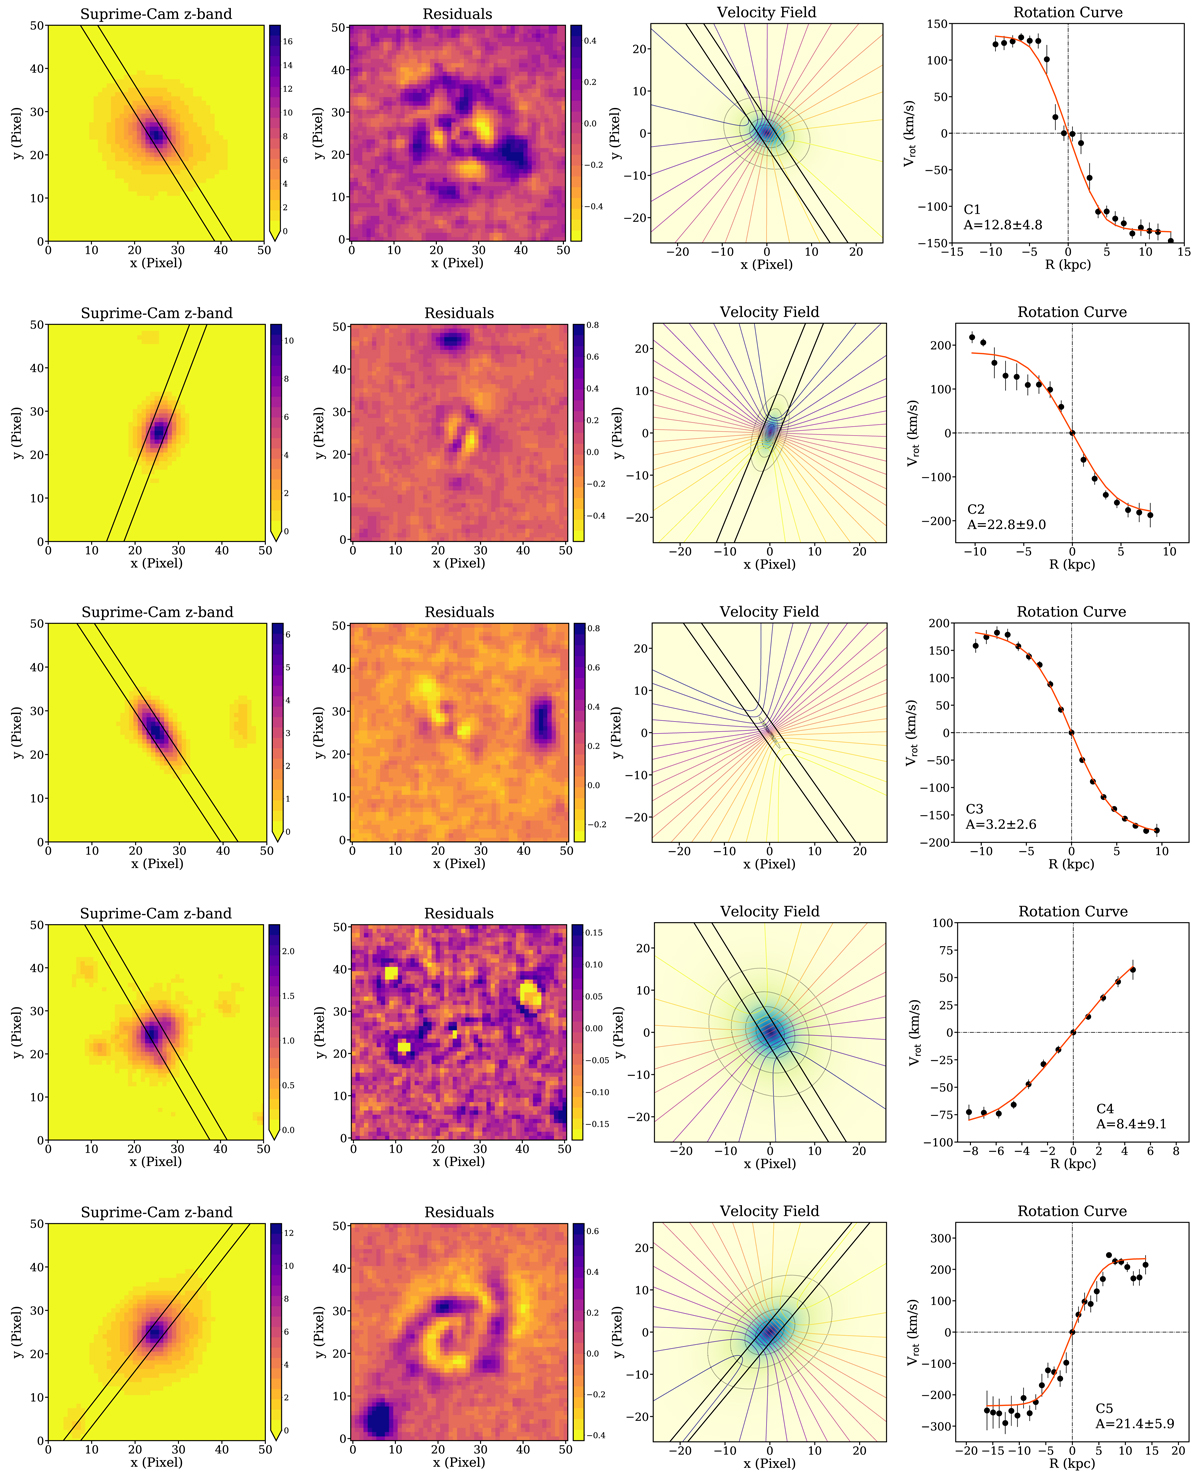
Our sample of cluster galaxies studied following the methods explained in Sect. 3 and presented in the same order as in Table A.1. Col. 1: z-band Suprime-Cam image centered on the target; Col. 2: residuals after subtracting the 2D model of the galaxy; Col. 3: synthetic velocity field after fitting the simulated rotation curve to the observed curve; Col. 4: rotation curve (black dots) in the observed frame and the simulated rotation curve (red line). The black solid parallel lines in the panels in Cols. 1 and 3 depict the position of the edges of the slit.
Current usage metrics show cumulative count of Article Views (full-text article views including HTML views, PDF and ePub downloads, according to the available data) and Abstracts Views on Vision4Press platform.
Data correspond to usage on the plateform after 2015. The current usage metrics is available 48-96 hours after online publication and is updated daily on week days.
Initial download of the metrics may take a while.