Fig. 8.
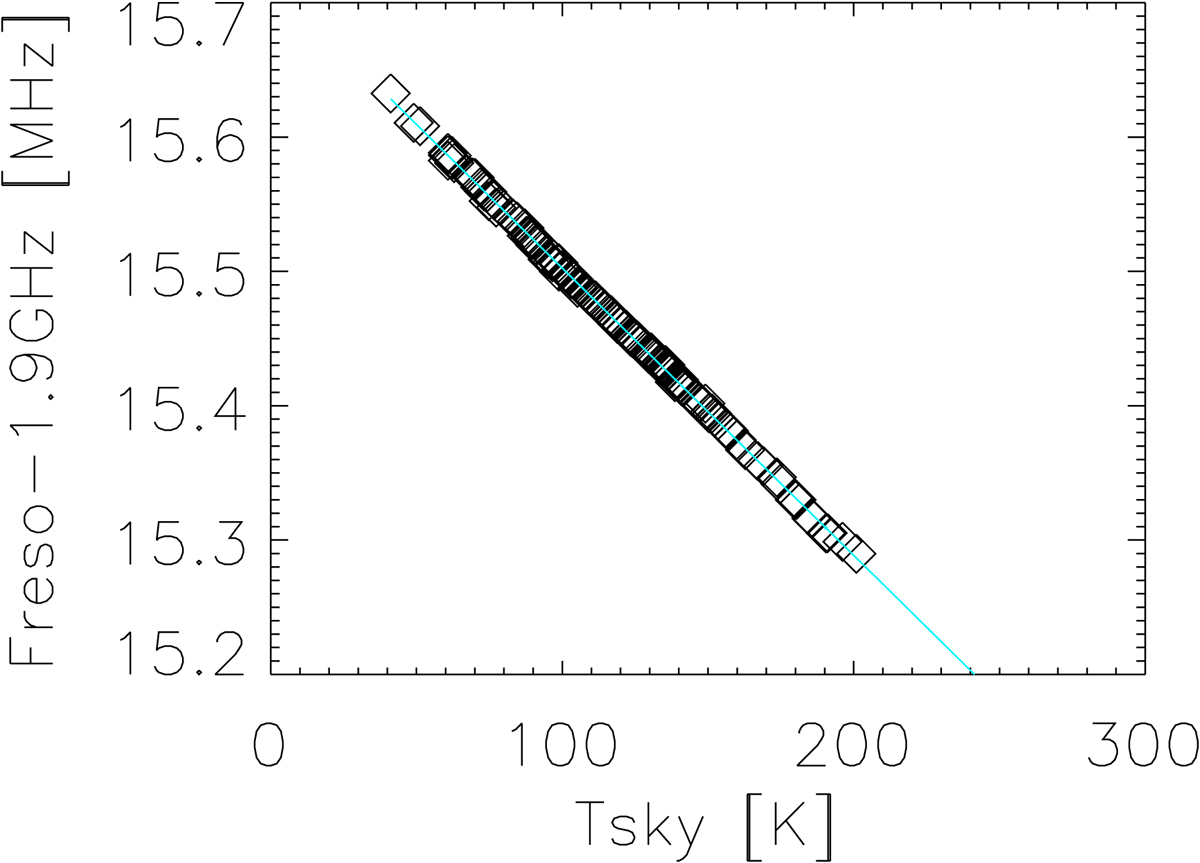
Example of global skydip fit for a KID. Each square point represents one step in a skydip (made of eleven elevation steps). A series of 12 skydip scans are jointly used, spanning zenith opacities from 0.15 to 0.50 in the 1 mm band. The horizontal axis gives the sky effective temperature Tsky = Tatm[1 − e−τν x] in Kelvins, where τν is the skydip zenith opacity found in the fit. The vertical axis shows the relative resonance frequency of the KID with respect to 1.9 GHz, given in MHz. The blue line is the linear model using the best-fit ![]() and
and ![]() coefficients (see Eq. (12)).
coefficients (see Eq. (12)).
Current usage metrics show cumulative count of Article Views (full-text article views including HTML views, PDF and ePub downloads, according to the available data) and Abstracts Views on Vision4Press platform.
Data correspond to usage on the plateform after 2015. The current usage metrics is available 48-96 hours after online publication and is updated daily on week days.
Initial download of the metrics may take a while.