Fig. 6.
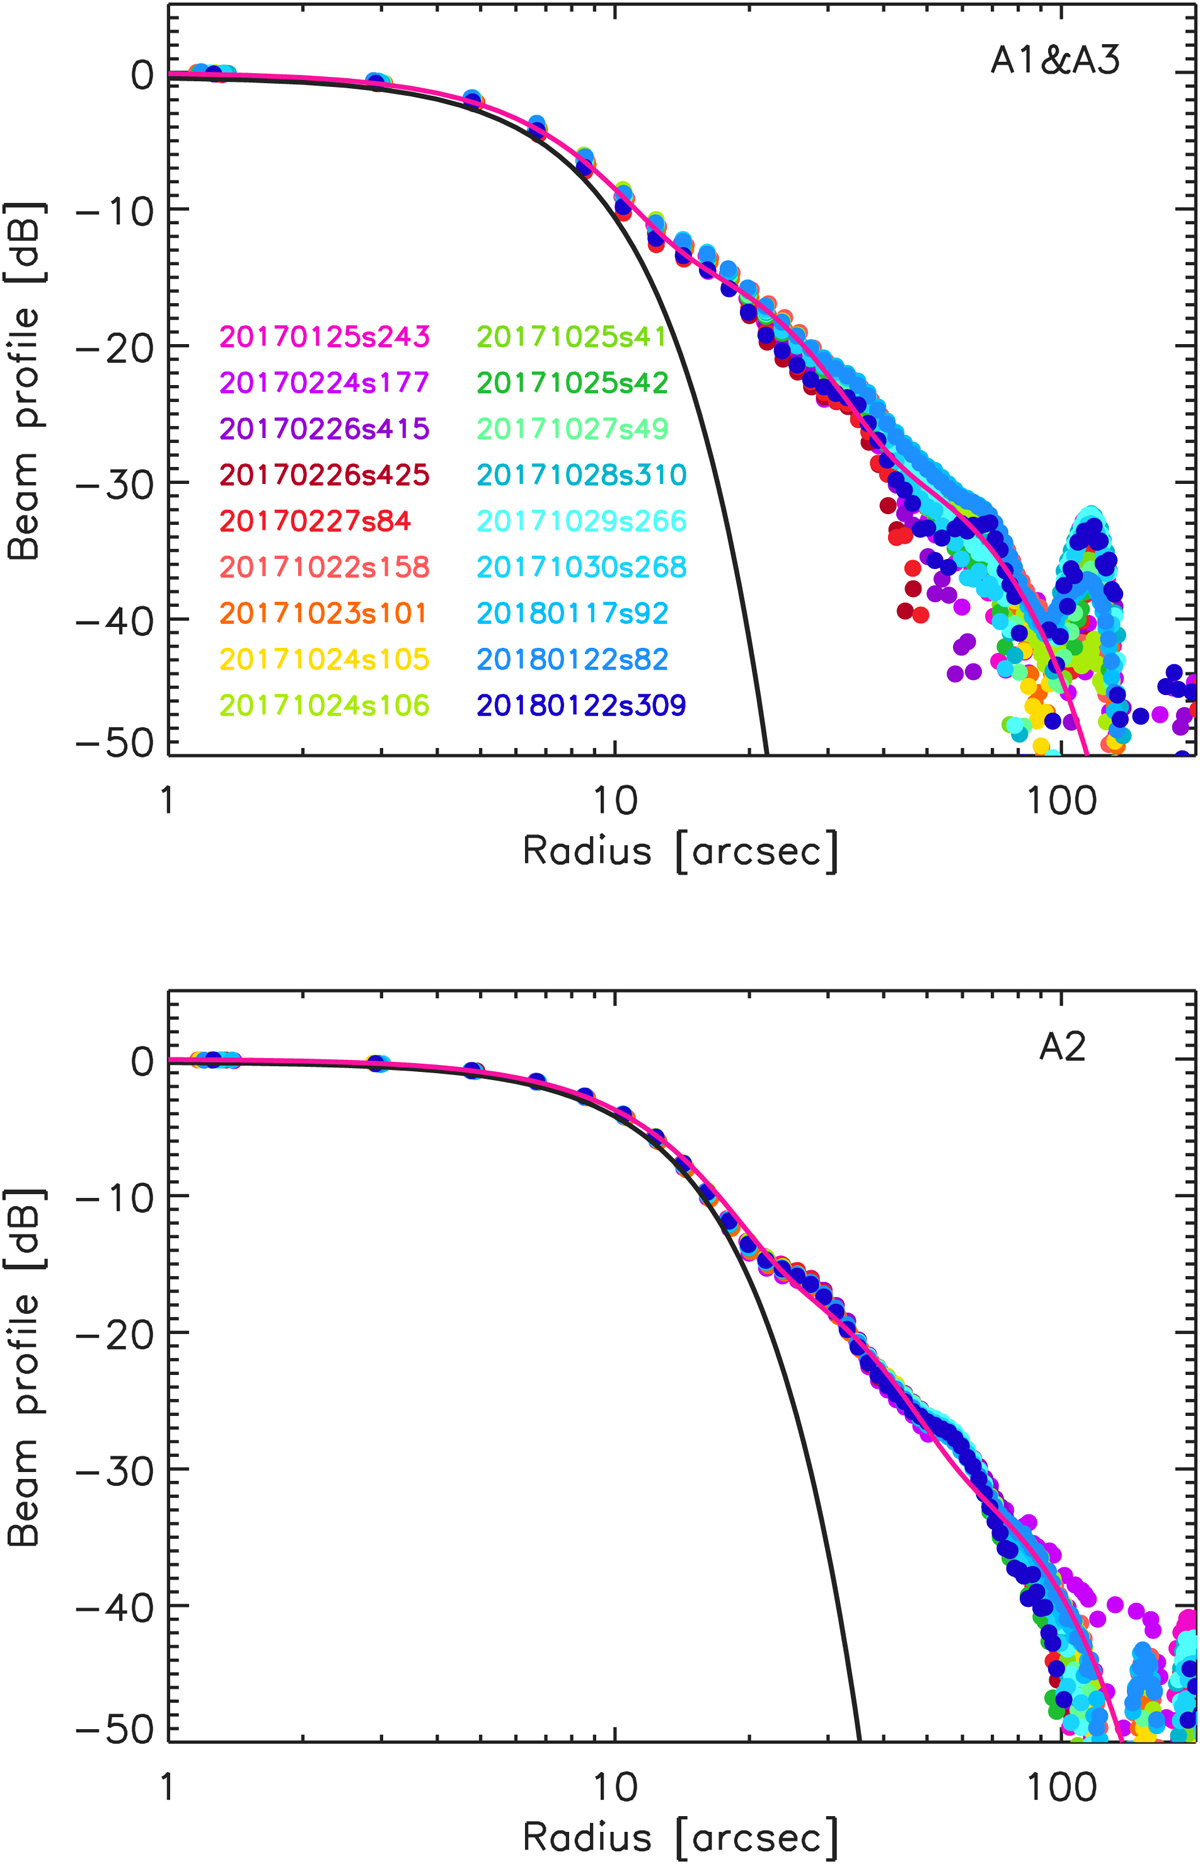
Beam radial profiles given in decibels. The data points are the beam profiles for a series of 18 beammap scans acquired during the reference observational campaigns, labelled from the scan ID. The black line shows the main-beam profile using the “combined” FWHM, as given in Table 6, while the pink line shows the median best-fit three-Gaussian profile, as defined in Eq. (3).
Current usage metrics show cumulative count of Article Views (full-text article views including HTML views, PDF and ePub downloads, according to the available data) and Abstracts Views on Vision4Press platform.
Data correspond to usage on the plateform after 2015. The current usage metrics is available 48-96 hours after online publication and is updated daily on week days.
Initial download of the metrics may take a while.