Fig. 5.
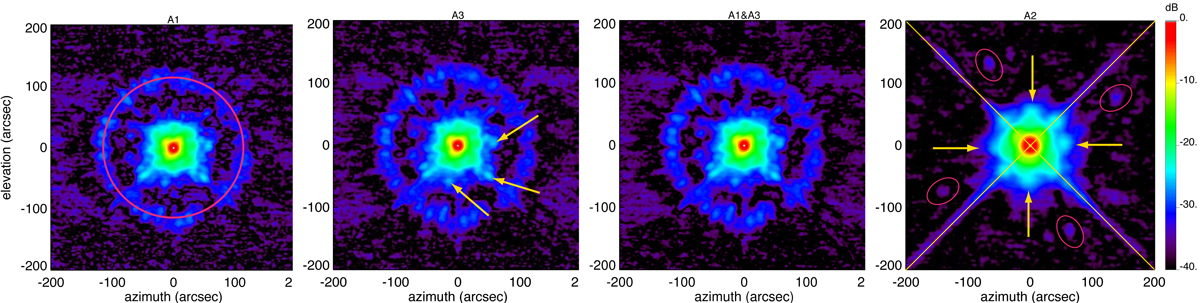
From left to right, beam maps of A1, A3, the combination of the 1 mm arrays (A1 and A3), and the 2 mm array (A2) are shown in decibels. These maps, which consist of the normalised combination of four beammap scans of bright point-like sources, are in horizontal coordinates. They represent a zoom in the inner part of larger maps that cover a sky area which extends over 10′. The solid lines and arrows highlight some noticeable features. Red circle in the A1 map (first panel): diffraction ring seen in 1 mm maps (the spokes are presumably caused by radial and azimuthal panel buckling (Greve et al. 2010); orthogonal yellow lines in the A2 map (rightmost panel): diffraction pattern caused by the quadrupod secondary support structure (prominently seen in A2 map); yellow arrows in the A3 map (second panel): pattern of three spikes seen in 1 mm maps of unknown origin; yellow arrows in A2 map (fourth panel): four symmetrical spikes of the first side lobes; pink ellipses: four spikes seen in A2 maps.
Current usage metrics show cumulative count of Article Views (full-text article views including HTML views, PDF and ePub downloads, according to the available data) and Abstracts Views on Vision4Press platform.
Data correspond to usage on the plateform after 2015. The current usage metrics is available 48-96 hours after online publication and is updated daily on week days.
Initial download of the metrics may take a while.