Fig. 4.
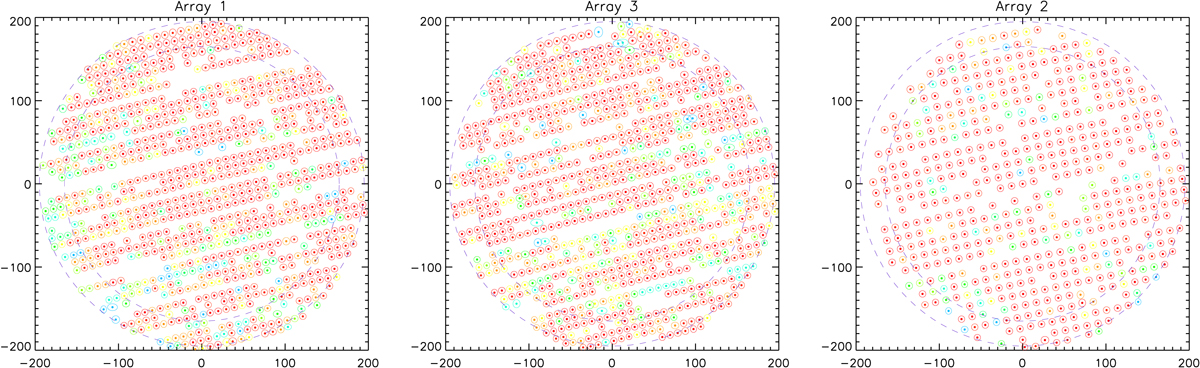
Average detector positions for arrays A1, A3, and A2. The three plots show the detectors that met the selection quality criteria for at least two beammaps during two technical campaigns. These consist of 952, 961, and 553 detectors for A1, A3, and A2, respectively. The colour indicates how many times a KID was identified as valid on a beammap, ranging from blue for the KIDs valid in at least two beammaps, to red for the KIDs valid in all (ten) beammaps. The inner and outer dash-line circles correspond to circular regions of 5.5 arcmin and 6.5 arcmin, respectively. Units used are arcseconds.
Current usage metrics show cumulative count of Article Views (full-text article views including HTML views, PDF and ePub downloads, according to the available data) and Abstracts Views on Vision4Press platform.
Data correspond to usage on the plateform after 2015. The current usage metrics is available 48-96 hours after online publication and is updated daily on week days.
Initial download of the metrics may take a while.