Open Access
Fig. 3.
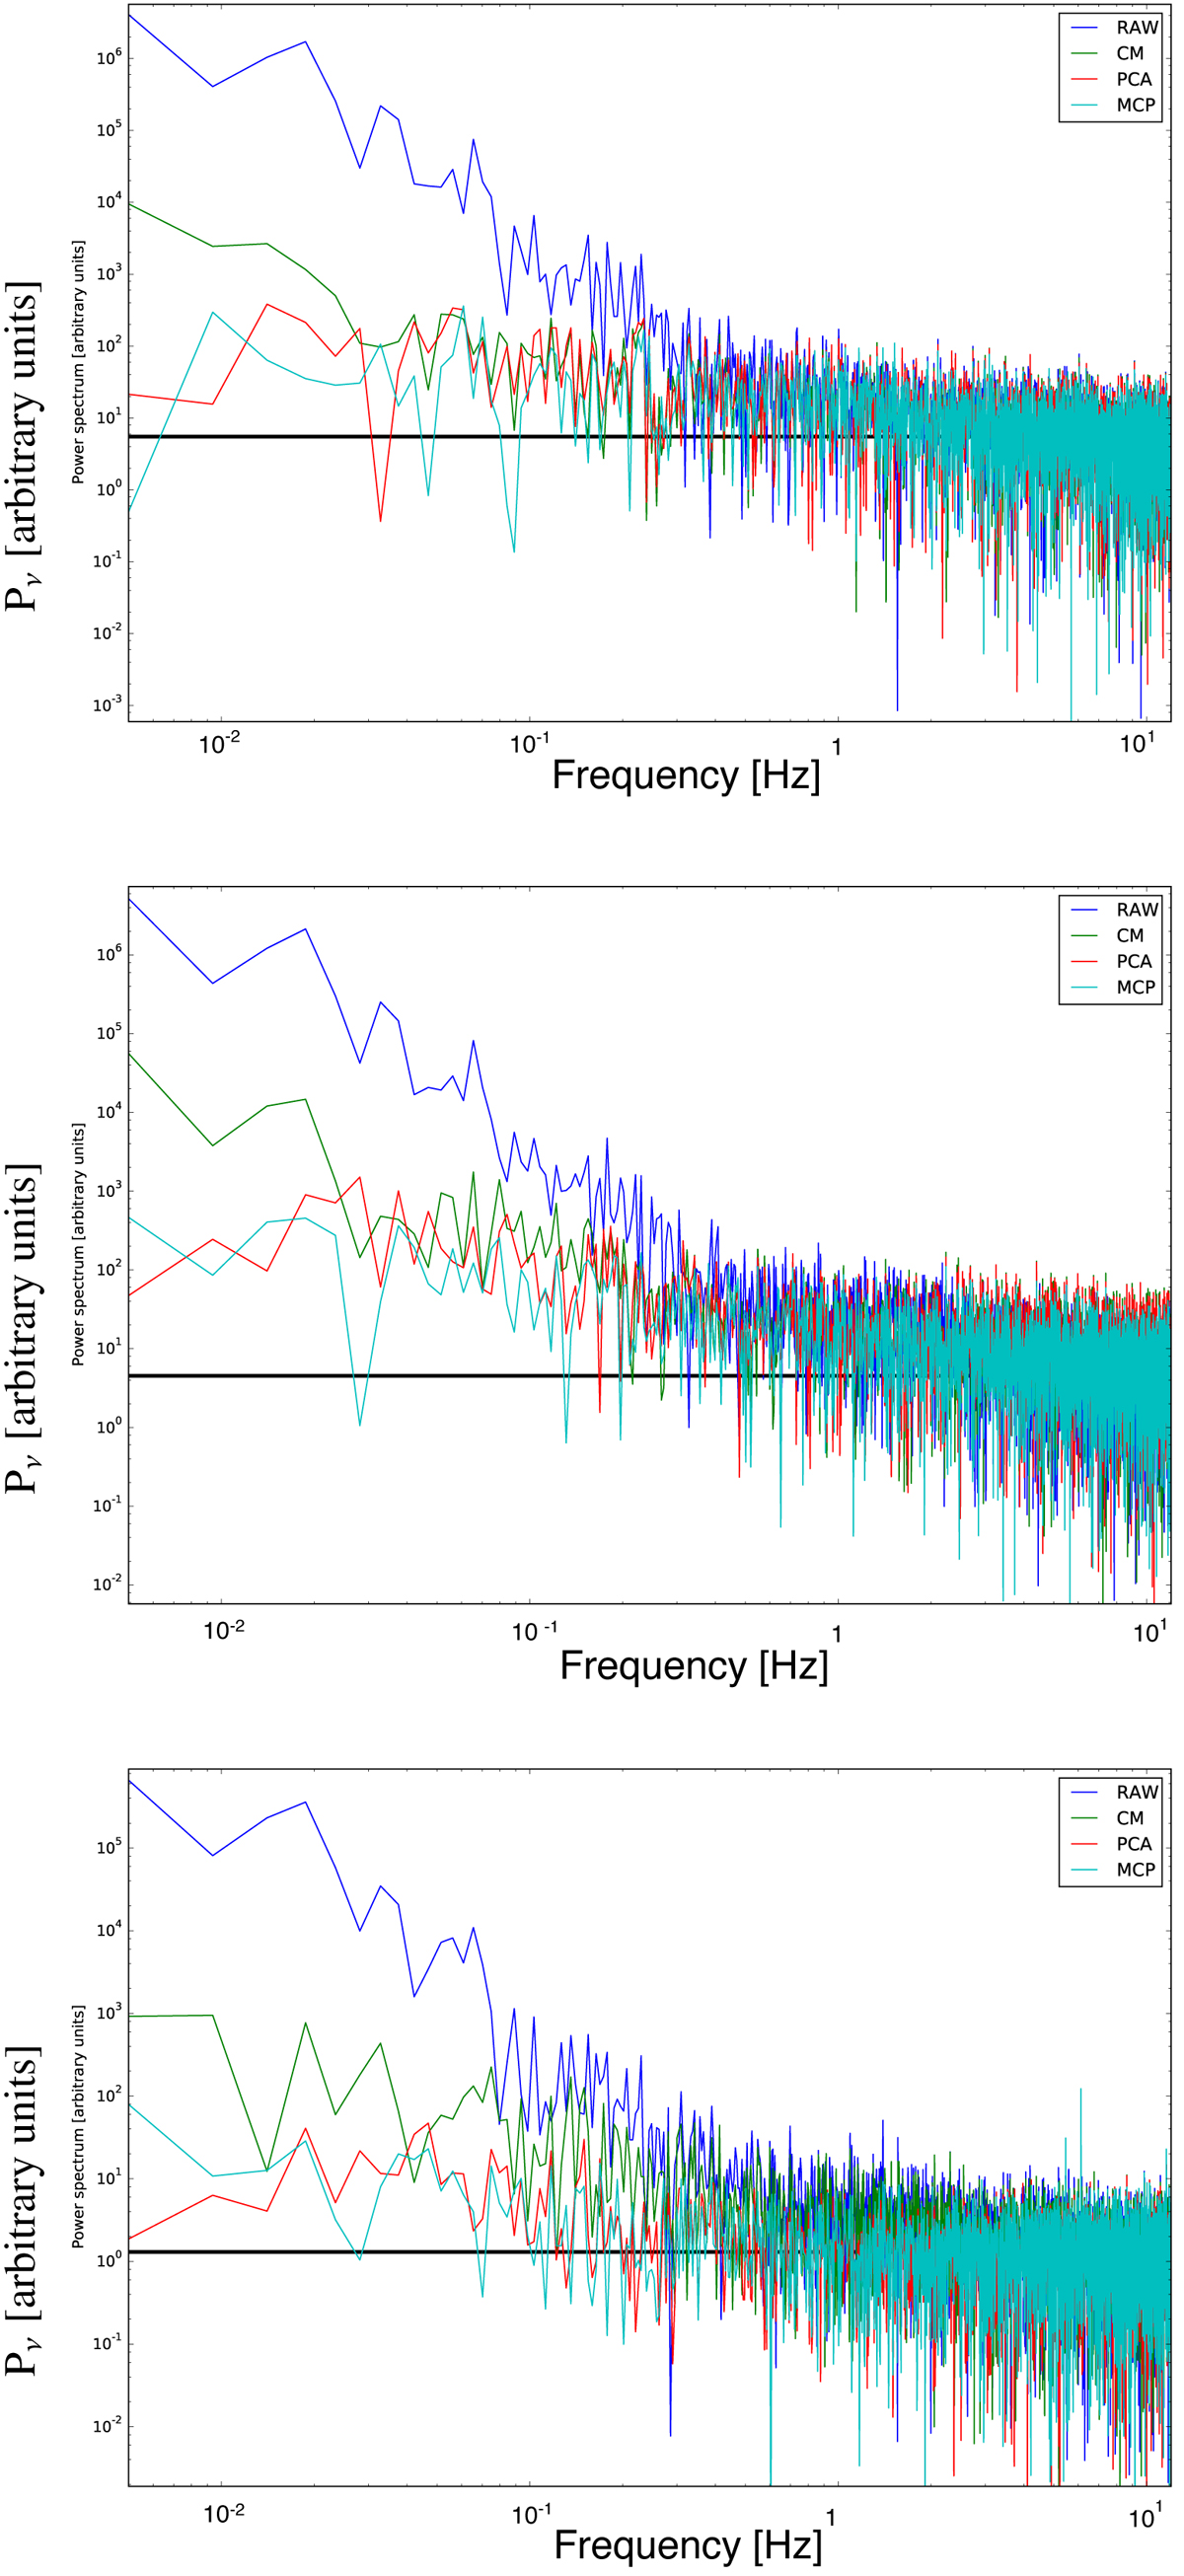
Data noise power spectra for the three NIKA2 arrays (A1, A3, and A2 from top to bottom). The power spectra are given for the raw data (blue), and for noise de-correlated data using the common mode (labelled CM, green), the PCA (red) and the Most Correlated Pixels (labelled MCP, cyan) methods.
Current usage metrics show cumulative count of Article Views (full-text article views including HTML views, PDF and ePub downloads, according to the available data) and Abstracts Views on Vision4Press platform.
Data correspond to usage on the plateform after 2015. The current usage metrics is available 48-96 hours after online publication and is updated daily on week days.
Initial download of the metrics may take a while.