Fig. C.3.
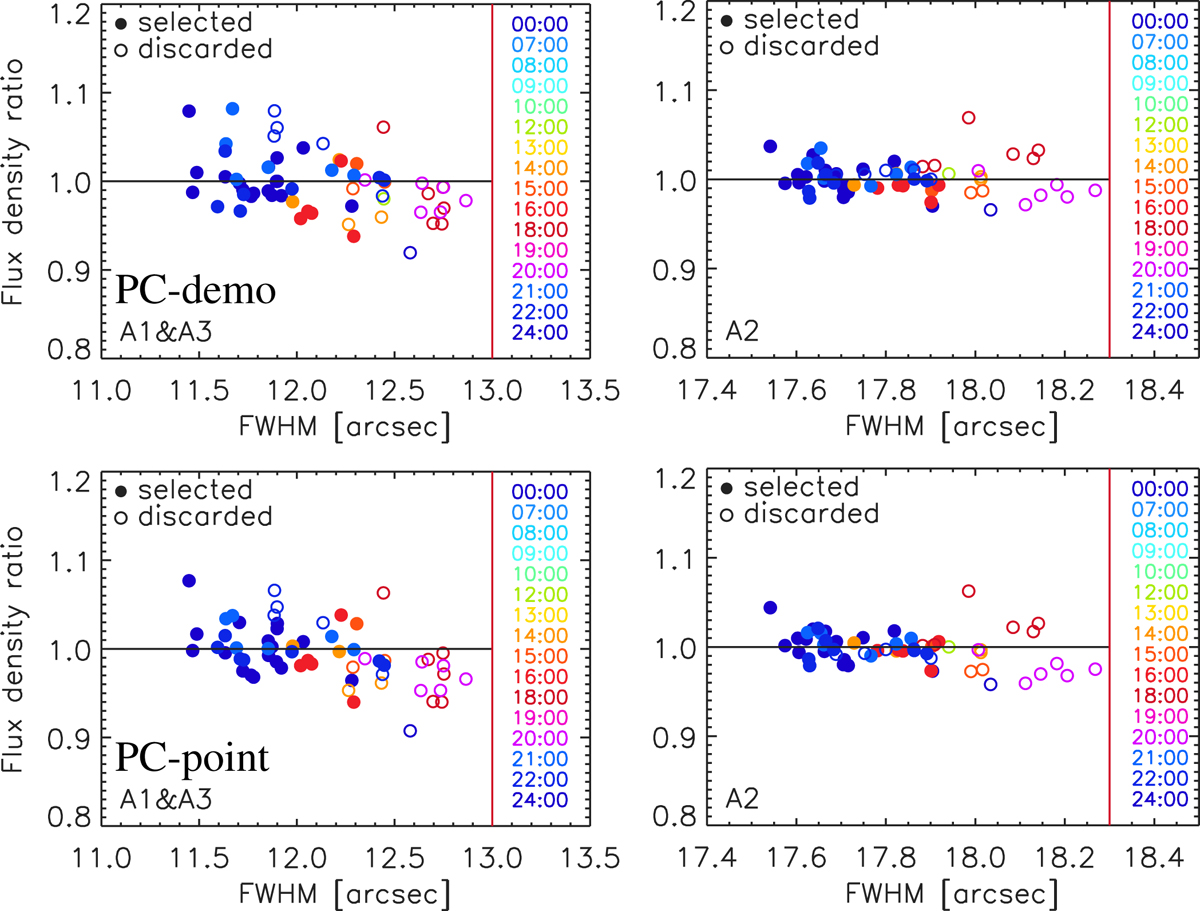
Uranus flux-density ratio vs beam size for calibration with photometric correction. The ratio of Uranus’ measured flux densities to expectations as a function of the measured 2D Gaussian beam FWHM is shown for the 1 mm array combination (left column) and for Array 2 (right column) after absolute calibration using (first row) the PC-demo and (second row) the PC-point photometric corrections. These plots include all Uranus scans acquired during N2R9, N2R12, and N2R14 campaigns and for which the beam FWHMs are below the threshold indicated by the vertical red lines, (open circles), as well as the scans that met the Baseline scan selection criteria (filled circles). A total of 38 scans now pass the Baseline selection criteria vs only 26 without photometric correction (see also Fig. 13).
Current usage metrics show cumulative count of Article Views (full-text article views including HTML views, PDF and ePub downloads, according to the available data) and Abstracts Views on Vision4Press platform.
Data correspond to usage on the plateform after 2015. The current usage metrics is available 48-96 hours after online publication and is updated daily on week days.
Initial download of the metrics may take a while.