Fig. B.1.
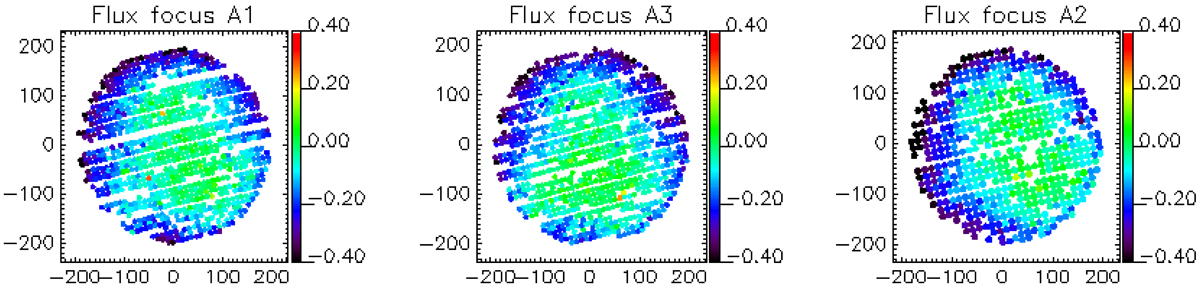
Focus surface of A1, A3, and A2 from left to right. In this example, the focus estimates rely on the maximisation of the flux density. On each plot, the x and y axis are the Nasmyth offsets with regard to the centre of the array in arcseconds, while the colour-code represents the relative focus estimate with regard to the central focus, given in mm.
Current usage metrics show cumulative count of Article Views (full-text article views including HTML views, PDF and ePub downloads, according to the available data) and Abstracts Views on Vision4Press platform.
Data correspond to usage on the plateform after 2015. The current usage metrics is available 48-96 hours after online publication and is updated daily on week days.
Initial download of the metrics may take a while.